
Mathematics, 14.02.2020 04:13 echavarrianoah
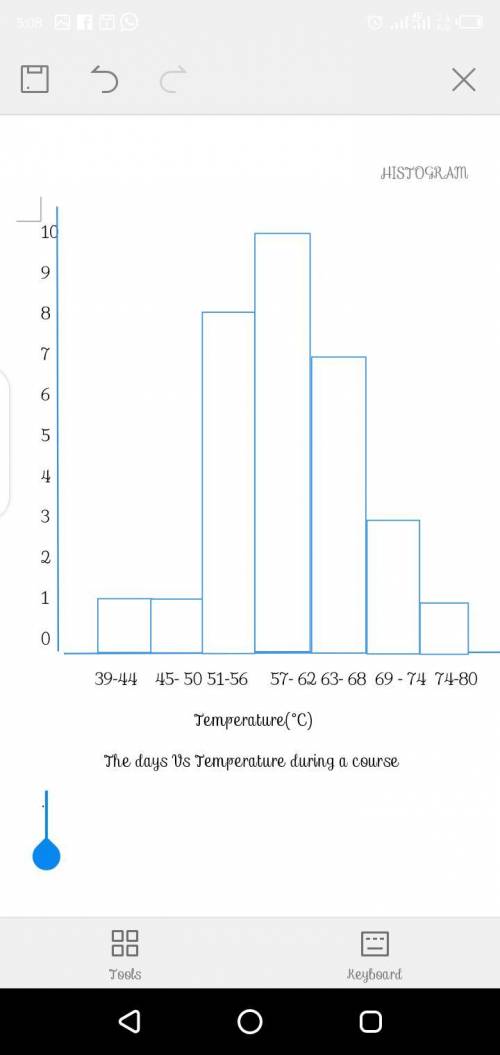
The frequency distribution below represents frequencies of actual low temperatures recorded during the course of a 31-day month. Use the frequency distribution to construct a histogram. Do the data appear to have a distribution that is approximately normal?
Class Frequency
A 39 minus 44 1
B 45 minus 50 1
C 51 minus 56 8
D 57 minus 62 10
E 63 minus 68 7
F 69 minus 74 3
G 75 minus 80 1

Answers: 3


Another question on Mathematics
Mathematics, 21.06.2019 14:00
Suppose a man is heterozygous for heterochromia, an autosomal dominant disorder which causes two different‑colored eyes in an individual, produced 25‑offspring with his normal‑eyed wife. of their children, 15 were heterochromatic and 10 were‑normal. calculate the chi‑square value for this observation.
Answers: 1
Mathematics, 21.06.2019 16:00
Given a circle with measures of (c, d, and r) and a circle with measures of (c', d', and r'), what is d if c c' = 12 and d' = 0.50? a) 3 b) 6 c) 12 d) 24
Answers: 2
Mathematics, 21.06.2019 18:30
Players on the school soccer team are selling candles to raise money for an upcoming trip. each player has 24 candles to sell. if a player sells 4 candles a profit of$30 is made. if he sells 12 candles a profit of $70 is made
Answers: 2
Mathematics, 21.06.2019 20:00
Find the least common multiple of the expressions: 1. 3x^2, 6x - 18 2. 5x, 5x(x +2) 3. x^2 - 9, x + 3 4. x^2 - 3x - 10, x + 2 explain if possible
Answers: 1
You know the right answer?
The frequency distribution below represents frequencies of actual low temperatures recorded during t...
Questions
Mathematics, 07.07.2019 12:30

History, 07.07.2019 12:30
Mathematics, 07.07.2019 12:30

History, 07.07.2019 12:30


Physics, 07.07.2019 12:30

English, 07.07.2019 12:30

Social Studies, 07.07.2019 12:30
English, 07.07.2019 12:30
English, 07.07.2019 12:30
Mathematics, 07.07.2019 12:30

Biology, 07.07.2019 12:30


