
Mathematics, 14.02.2020 02:08 thisusernameistaken2
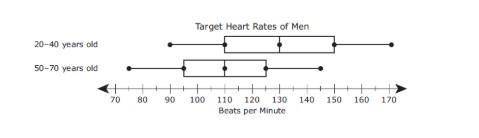
The box plots show the target heart rates of men 20–40 years old and men 50–70 years old.
Which statement is best supported by the information in the box plots?
A) The range of the data for men 20–40 years old is less than the range of the data for men 50–70 years old.
B) The median of the data for men 20–40 years old is less than the median of the data for men 50–70 years old.
C) The minimum target heart rate for men 20–40 years old is less than the minimum target heart rate for men 50–70 years old.
D) The interquartile range of the data for men 20–40 years old is greater than the interquartile range of the data for men 50–70 years old.

Answers: 2


Another question on Mathematics
Mathematics, 21.06.2019 18:50
Determine which expressions represent real numbers and which expressions represent complex number. asaaap! plis!
Answers: 1
Mathematics, 21.06.2019 19:30
If the ratio of sum of the first m and n terms of an ap is m2 : n2 , show that the ratio of its mth and nth terms is (2m − 1) : (2n − 1).
Answers: 3
Mathematics, 21.06.2019 21:30
Suppose that sahil knows that 45 people with ages of 18 to 29 voted. without using a calculator, he quickly says then 135 people with ages of 30to 49 voted. is he correct? how might sohil have come up with his answer so quickly?
Answers: 3
You know the right answer?
The box plots show the target heart rates of men 20–40 years old and men 50–70 years old.
Questions

Mathematics, 17.10.2021 17:10
History, 17.10.2021 17:10

Computers and Technology, 17.10.2021 17:10


Business, 17.10.2021 17:10
Mathematics, 17.10.2021 17:10

Social Studies, 17.10.2021 17:10

Mathematics, 17.10.2021 17:10

Chemistry, 17.10.2021 17:10
Physics, 17.10.2021 17:10

Biology, 17.10.2021 17:10


