Please help me c:
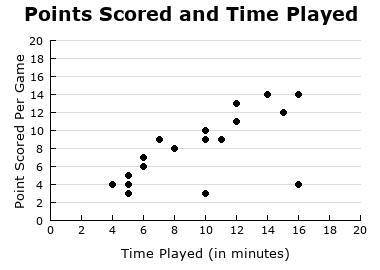
The scatter plot shows the amount of time Oscar played and the number...

Mathematics, 10.02.2020 20:20 jonellelewis2897
Please help me c:
The scatter plot shows the amount of time Oscar played and the number of points he scored during each basketball game. Which describes the association of the variables in the data?
A) no association
B) nonlinear association
Eliminate
C) positive, linear association
D) negative, linear association
tysm for your time! c:

Answers: 1


Another question on Mathematics
Mathematics, 21.06.2019 13:00
Ihave a 69 and an 82. the 69 is worth 40% of my grade and the 82 is worth 15%. can someone tell me my current average grade.
Answers: 1
Mathematics, 22.06.2019 00:00
Asunflower was 20 1/2 inches tall. over the next 6 months, it grew to a height of 37 inches tall. what was the average yearly growth rate of the height of the sunflower? ? plz write a proportion to solve i will give you 100 points
Answers: 2
You know the right answer?
Questions


History, 24.07.2019 21:20
Mathematics, 24.07.2019 21:20
Mathematics, 24.07.2019 21:20

Computers and Technology, 24.07.2019 21:20


Mathematics, 24.07.2019 21:30


