
Mathematics, 10.02.2020 19:42 stephanieb75
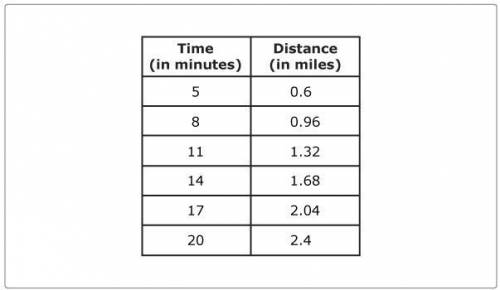
Shelly and her family are riding the Pikes Peak Cog Railway. The table shows the approximate distances the train has covered at the end of different time periods.
PLEASE ANSWER
Based on the information in the table, which equation can be used to find the distance (d), the train will travel in any number of minutes (m)?
A. d=0.12m
B. d=0.18m
C. d=0.36m
D. d= 0.83m

Answers: 1


Another question on Mathematics
Mathematics, 21.06.2019 22:00
The two box p digram the two box plots show the data of the pitches thrown by two pitchers throughout the season. which statement is correct? check all that apply. pitcher 1 has a symmetric data set. pitcher 1 does not have a symmetric data set. pitcher 2 has a symmetric data set. pitcher 2 does not have a symmetric data set. pitcher 2 has the greater variation.ots represent the total number of touchdowns two quarterbacks threw in 10 seasons of play
Answers: 1
Mathematics, 21.06.2019 22:30
The median for the given set of six ordered data values is 29.5 9 12 25 __ 41 48 what is the missing value?
Answers: 1
Mathematics, 22.06.2019 02:30
Atrain traveled for 1.5 hours to the first station, stopped for 30 minutes, then traveled for 4 hours to the final station where it stopped for 1 hour. the total distance traveled is a function of time. which graph most accurately represents this scenario? a graph is shown with the x-axis labeled time (in hours) and the y-axis labeled total distance (in miles). the line begins at the origin and moves upward for 1.5 hours. the line then continues upward at a slow rate until 2 hours. from 2 to 6 hours, the line continues quickly upward. from 6 to 7 hours, it moves downward until it touches the x-axis a graph is shown with the axis labeled time (in hours) and the y axis labeled total distance (in miles). a line is shown beginning at the origin. the line moves upward until 1.5 hours, then is a horizontal line until 2 hours. the line moves quickly upward again until 6 hours, and then is horizontal until 7 hours a graph is shown with the axis labeled time (in hours) and the y-axis labeled total distance (in miles). the line begins at the y-axis where y equals 125. it is horizontal until 1.5 hours, then moves downward until 2 hours where it touches the x-axis. the line moves upward until 6 hours and then moves downward until 7 hours where it touches the x-axis a graph is shown with the axis labeled time (in hours) and the y-axis labeled total distance (in miles). the line begins at y equals 125 and is horizontal for 1.5 hours. the line moves downward until 2 hours, then back up until 5.5 hours. the line is horizontal from 5.5 to 7 hours
Answers: 1
Mathematics, 22.06.2019 04:30
The motion of a weight that hangs from a spring is represented by the equation h=8sin(2pi/3t). it models the weight’s height above or below the rest position as a function of time. approximately when will the object be 3 inches above the rest position?
Answers: 1
You know the right answer?
Shelly and her family are riding the Pikes Peak Cog Railway. The table shows the approximate distanc...
Questions

Physics, 05.01.2021 04:30

Health, 05.01.2021 04:30
Physics, 05.01.2021 04:30

Computers and Technology, 05.01.2021 04:30
Mathematics, 05.01.2021 04:30


History, 05.01.2021 04:30

Arts, 05.01.2021 04:30
History, 05.01.2021 04:30
Physics, 05.01.2021 04:30


Advanced Placement (AP), 05.01.2021 04:30
Health, 05.01.2021 04:30
Mathematics, 05.01.2021 04:30
Mathematics, 05.01.2021 04:30
Biology, 05.01.2021 04:30

Chemistry, 05.01.2021 04:30
English, 05.01.2021 04:30


