Normal distribution
using the graph as a reference, select all
statements that are true...

Mathematics, 04.02.2020 05:50 tjuicy1
Normal distribution
using the graph as a reference, select all
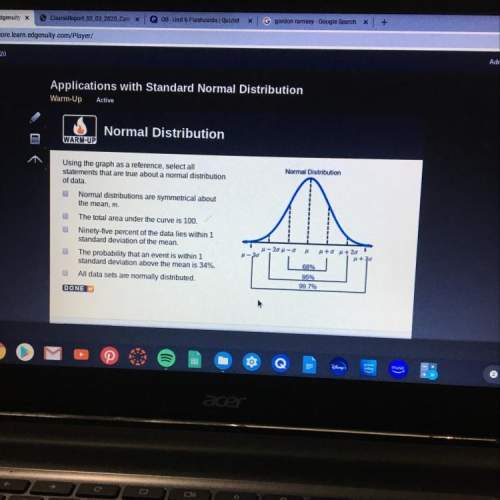
statements that are true about a normal distribution
of data.
normal distributions are symmetrical about
the mean, m.
the total area under the curve is 100.
ninety-five percent of the data lies within 1
standard deviation of the mean.
the probability that an event is within 1
standard deviation above the mean is 34%.
all data sets are normally distributed

Answers: 1


Another question on Mathematics
Mathematics, 21.06.2019 17:20
Four airplanes carrying a total of 400 passengersarrive at the detroit airport. the airplanes carry, respectively,50, 80, 110, and 160 passengers.a) one of the 400 passengers is selected uniformly at random.let x denote the number of passengers that were on theairplane carrying the randomly selected passenger. find var(x)for x as given in the problemb) one of the 4 airplane drivers is also selected uniformly atrandom. let y denote the number of passengers on the chosen driver’s airplane. find var(y) for y as given in the problem
Answers: 3
Mathematics, 21.06.2019 17:30
Lindsay used two points, (x,y; ) and (+2.82), to find the equation of the line, y = mx + b, that passes through the points. y2-y, first, she used the definition of slope and determined that the value of mis x, - . given this information, which expression must represent the value of b?
Answers: 2
Mathematics, 21.06.2019 19:30
Which describes the difference between the graph of f(x)=x^2 and g(x)=-(x^2-2)
Answers: 1
You know the right answer?
Questions
Mathematics, 24.02.2022 07:30
Mathematics, 24.02.2022 07:30


History, 24.02.2022 07:30


Computers and Technology, 24.02.2022 07:40
Mathematics, 24.02.2022 07:40

Geography, 24.02.2022 07:40
Mathematics, 24.02.2022 07:40

Computers and Technology, 24.02.2022 07:40

Mathematics, 24.02.2022 07:40


