
Mathematics, 27.01.2020 12:31 muhammadcorley123456
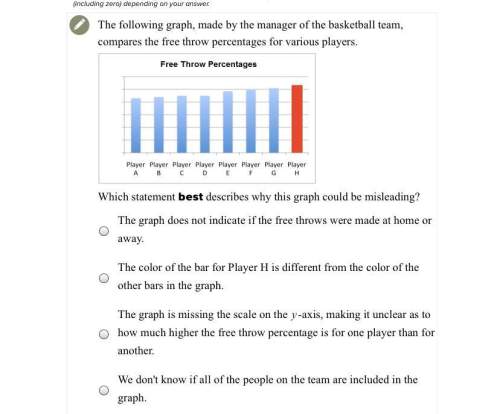
The following graph, made by the manager of the basketball team, compares the free throw percentages for various players.
which statement best describes why this graph could be misleading?
a. the graph does not indicate if the free throws were made at home or away.
b. the color of the bar for player h is different from the color of the other bars in the graph.
c. the graph is missing the scale on the y-axis, making it unclear as to how much higher the free throw percentage is for one player than for another.
d. we don't know if all of the people on the team are included in the graph.

Answers: 1


Another question on Mathematics
Mathematics, 21.06.2019 13:00
How can we find the measure of an exterior angle if we know the measurement of an interior angle
Answers: 2
Mathematics, 21.06.2019 16:40
If 24 people have the flu out of 360 people, how many would have the flu out of 900. choose many ways you could use proportion that david would use to solve this problem
Answers: 1
Mathematics, 21.06.2019 19:50
A3-dimensional figure has a square base and 4 lateral faces that meet at a point. explain the difference between the cross sections when a slice is made perpendicular to the base through the vertex, and when a slice is made perpendicular to the base and not through the vertex
Answers: 2
Mathematics, 21.06.2019 21:40
Use sigma notation to represent the following series for 9 terms.
Answers: 2
You know the right answer?
The following graph, made by the manager of the basketball team, compares the free throw percentages...
Questions
Mathematics, 07.05.2020 06:06

History, 07.05.2020 06:06

Mathematics, 07.05.2020 06:06
Mathematics, 07.05.2020 06:06


Arts, 07.05.2020 06:06

History, 07.05.2020 06:06
Mathematics, 07.05.2020 06:06
Mathematics, 07.05.2020 06:06


