
Mathematics, 24.01.2020 23:31 alleydog38511
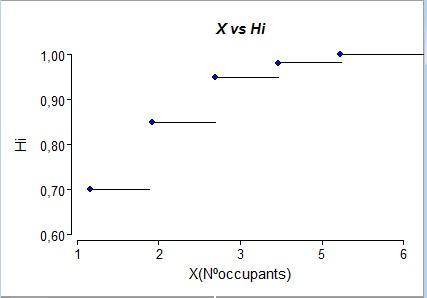
Asample of 100 cars driving on a freeway during a morning commute was drawn, and the number of occupants in each car was recorded the results were as follows:
occupants 1 2 3 4 5
number of cars 70 15 10 3 2
a. find the sample mean number of occupants.
b. find the sample standard deviation of the number of occupants.
c. find the sample median number of occupants.
d. compute the first and third quartiles of the number of occupants.
e. what proportion of cars had more than the mean number of occupants?
f. for what proportion of cars was the number of occupants more than one standard deviation greater than the mean?
g. for what proportion of cars was the number of occupants within one standard deviation of the mean?

Answers: 1
![X[bar]= \frac{sumx*fi}{n}](/tpl/images/0469/5776/f8dcf.png)
![X[bar]= \frac{152}{100}](/tpl/images/0469/5776/df4fc.png)
![X[bar]= 1.52](/tpl/images/0469/5776/3fad2.png)
![S^2= \frac{1}{n-1} [sumx^2fi-\frac{(sumx*fi)^2}{n} ]](/tpl/images/0469/5776/50764.png)
![S^2= \frac{1}{99}[318-\frac{(152)^2}{100} ]](/tpl/images/0469/5776/3d74e.png)


Another question on Mathematics
Mathematics, 21.06.2019 19:30
Atemperature of 1.64◦f corresponds to answer in units of ◦c.
Answers: 1
Mathematics, 21.06.2019 20:00
How long does it take natsumi to clean up after she is done? table: .area time30. 245. 2.7560. 3.5
Answers: 2
Mathematics, 21.06.2019 22:10
Erinn wrote the equation –5x + 4y = 32 to represent her hourly wage (y) and how this wage has changed during each year that she worked at a company (x). what is the rate of change in erinn's hourly wage per year?
Answers: 2
Mathematics, 21.06.2019 23:30
The scatterplot represents the total fee for hours renting a bike. the line of best fit for the data is y = 6.855x + 10.215. which table shows the correct residual values for the data set?
Answers: 1
You know the right answer?
Asample of 100 cars driving on a freeway during a morning commute was drawn, and the number of occup...
Questions

English, 23.01.2021 01:50


Geography, 23.01.2021 02:00
English, 23.01.2021 02:00
Mathematics, 23.01.2021 02:00
Mathematics, 23.01.2021 02:00


Biology, 23.01.2021 02:00
Mathematics, 23.01.2021 02:00
English, 23.01.2021 02:00

History, 23.01.2021 02:00
Mathematics, 23.01.2021 02:00


