Not everyone pays the same price for the same model of
a car. the figure illustrates a normal d...

Mathematics, 17.01.2020 02:31 ellaemtagedeane
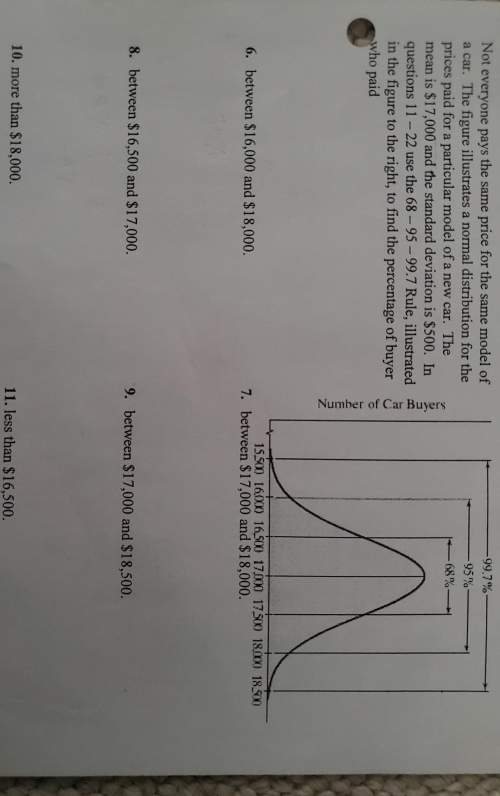
Not everyone pays the same price for the same model of
a car. the figure illustrates a normal distribution for the
prices paid for a particular model of a new car. the
mean is $17,000 and the standard deviation is $500. in
questions 11 - 22 use the 68 - 95 - 99.7 rule, illustrated
in the figure to the right to find the percentage of buyer
who paid
number of car buyers
6. between $16,000 and $18,000.
7. between $17,000 and $18,000.
8. between $16,500 and $17,000.
9. between $17,000 and $18,500.
10. more than $18,000.
11. less than $16,500.

Answers: 1


Another question on Mathematics
Mathematics, 21.06.2019 14:30
Your friend swims on the school team. in his first four races, his times are 24.7, 23.5, 25.6, and 27.2 seconds. which time listed for his next race would make the range larger?
Answers: 1
Mathematics, 21.06.2019 17:00
Twice the sum of a number and 4 is equal to three times the difference of the number and 7. find the number.
Answers: 1
Mathematics, 21.06.2019 18:30
The distance between two cities is 368 miles. if the scale on the map is 1/4 inch=23 miles, what is the distance between the cities on the map?
Answers: 3
Mathematics, 21.06.2019 22:00
Prove sin2a + cos2a - 1 / sin2a + cos2a + 1 = 1 - tana / 1 + cota
Answers: 2
You know the right answer?
Questions


Biology, 06.02.2022 23:10
Mathematics, 06.02.2022 23:10

Mathematics, 06.02.2022 23:10

History, 06.02.2022 23:10
History, 06.02.2022 23:10
Mathematics, 06.02.2022 23:10
Mathematics, 06.02.2022 23:20
Mathematics, 06.02.2022 23:20


