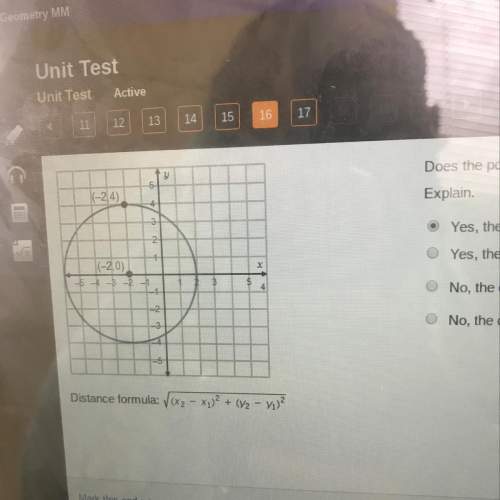
Select the correct answer.
the production of health drink cans at a warehouse can be represent...

Mathematics, 14.01.2020 22:31 kvngsavage156
Select the correct answer.
the production of health drink cans at a warehouse can be represented by the equation below, where x represents the hours of production,
and y the total supply of items in the warehouse, in hundreds.
y = x + 2
which of the following graphs represents this situation?

Answers: 3


Another question on Mathematics


Mathematics, 21.06.2019 15:00
Ricardo ran the 400 meter race 3 times his fastest time was 54.3 seconds his slowest time was 56.1 seconds if his average time was 55.0 seconds what was his time for the third race
Answers: 2

Mathematics, 21.06.2019 18:00
What is the equation of this graphed line? enter your answer in slope-intercept form in the box.
Answers: 2

You know the right answer?
Questions

Business, 02.04.2020 02:06


English, 02.04.2020 02:06

Business, 02.04.2020 02:06

Mathematics, 02.04.2020 02:06


Mathematics, 02.04.2020 02:07


