
Mathematics, 14.01.2020 17:31 blake2001
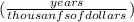
Table below shows the age in years and the retail value in thousands of dollars of a random sample of ten automobiles of the same make and model.
x 2 3 3 3 4 4 5 5 5 6
y 28.7 24.8 26.0 30.5 23.8 24.6 23.8 20.4 21.6 22.1
a) construct the scatter diagram.
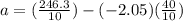
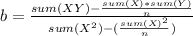
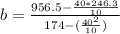
b) compute the linear correlation coefficient r. interpret its value in the context of the problem.
c) compute the least squares regression line. plot it on the scatter diagram.
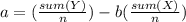
interpret the meaning of the slope of the least squares regression line in the context of the problem.
d) suppose a four-year-old automobile of this make and model is selected at random. use the regression equation to predict its retail value.
e) suppose a 20 -year-old automobile of this make and model is selected at random. use the regression equation to predict its retail value. interpret the result.
f) comment on the validity of using the regression equation to predict the price of a brand new automobile of this make and model.

Answers: 2
![r= \frac{sum(XY)-\frac{sum(X)*sum(Y)}{n} }{[sum(X^2)-\frac{(sum(X))^2}{n}] * [sum(Y^2)-\frac{(sum(Y))^2}{n} ] }](/tpl/images/0454/5277/ab4de.png)
![r= \frac{956.5-\frac{40*246.3}{10} }{[147-\frac{(40)^2}{10}] * [6154.15-\frac{(246.3)^2}{10} ] }](/tpl/images/0454/5277/2d906.png)
 is the modification of the estimated mean of the retail value of automobiles every time their age increases one year. In other words, every time the automobiles increase their age in one year, the price decreases 2.05 thousands of dollars.
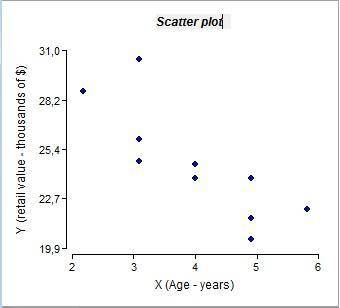


Another question on Mathematics
Mathematics, 21.06.2019 19:00
What is the expression in factored form? -x^2 + 3x + 28 a. (x-7)(x-4) b. -(x-7)(x+4) c. (x+4)(x+7) d. -(x-4)(x+7)
Answers: 2
Mathematics, 22.06.2019 00:00
Find the distance between the point (-3,-4), and (see the picture below)
Answers: 1
Mathematics, 22.06.2019 00:00
Afair die is cast four times. calculate the probability of obtaining exactly two 6's round to the nearest tenth of a percent
Answers: 1
You know the right answer?
Table below shows the age in years and the retail value in thousands of dollars of a random sample o...
Questions

Mathematics, 11.10.2019 12:30


Mathematics, 11.10.2019 12:30
Biology, 11.10.2019 12:30
Mathematics, 11.10.2019 12:30
Mathematics, 11.10.2019 12:30


Social Studies, 11.10.2019 12:30
Biology, 11.10.2019 12:30


Mathematics, 11.10.2019 12:30
Mathematics, 11.10.2019 12:30


