
Mathematics, 08.01.2020 23:31 HealTheWorld
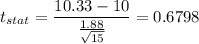
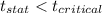
Maganement at a radio station wants to know the number of songs it plays per hour. a random sample over the past month yields the following counts for songs per hour: 9,13,12,8,7,10,11,10,8,12,13,9,10,1 2, and 11.a. the radio station wants to claim that they play more than 10 songs per hour. what are the null and alternative hypotheses that test this statement? b. what test willyou use to evalute the alternative hypothesis? what are the conditions of this test? are they met in this situation? c. calculate your test statistic and p-value. show your work. d. what's your critical t value and your conclusion (at a=.05)

Answers: 2
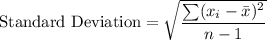
 are data points,
  is the mean and n is the number of observations.


Another question on Mathematics
Mathematics, 21.06.2019 16:00
The graph shows the distance y, in inches, a pendulum moves to the right (positive displacement) and to the left (negative displacement), for a given number of seconds x. how many seconds are required for the pendulum to move from its resting position and return? enter your answer in the box.
Answers: 2
Mathematics, 21.06.2019 21:00
Bella want to know what the students at her school think of her show. which is the best group to survey to find this information a. go to the mall and ask all of the students she recognizes from school b. ask her viewers to call in durning an episode of the show c. get a list of students at her school from the office and use a random number generator to pick 30 of them d. get a list of students at her school from the office and pick the first 30 students on the list
Answers: 1
Mathematics, 21.06.2019 21:30
Create a graph for the demand for starfish using the following data table: quantity/price of starfish quantity (x axis) of starfish in dozens price (y axis) of starfish per dozen 0 8 2 6 3 5 5 2 7 1 9 0 is the relationship between the price of starfish and the quantity demanded inverse or direct? why? how many dozens of starfish are demanded at a price of five? calculate the slope of the line between the prices of 6 (quantity of 2) and 1 (quantity of 7) per dozen. describe the line when there is a direct relationship between price and quantity.
Answers: 3
Mathematics, 21.06.2019 21:30
Find the volume of the solid obtained by rotating the region enclosed by the curves y=1x and y=7^-x about the x-axis. (use symbolic notation and fractions where needed.) volume =
Answers: 3
You know the right answer?
Maganement at a radio station wants to know the number of songs it plays per hour. a random sample o...
Questions


Mathematics, 20.04.2020 21:19

English, 20.04.2020 21:19
Mathematics, 20.04.2020 21:19
Mathematics, 20.04.2020 21:19


Chemistry, 20.04.2020 21:19
Mathematics, 20.04.2020 21:19
Mathematics, 20.04.2020 21:19


