 ----> equation A
 ----> equation B
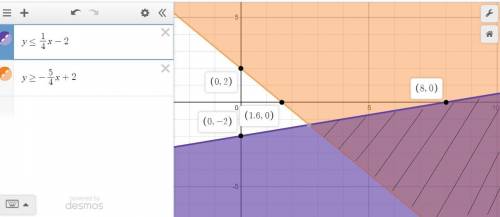
Which graph represents the solution set to the system of inequalities?
{y≤14x−2y≥−54x+2...

Mathematics, 17.12.2019 08:31 garasonmario
Which graph represents the solution set to the system of inequalities?
{y≤14x−2y≥−54x+2
coordinate graph showing a range of negative five and five on both axes. a solid line through begin ordered pair 0 comma 2 end ordered pair and begin ordered pair 4 comma negative 3 end ordered pair. another solid line through begin ordered pair 0 comma negative 2 end ordered pair and begin ordered pair 4 comma negative 1 end ordered pair. four regions are created by the intersection of the two lines. the right region is the shaded region.
coordinate graph showing a range of negative five and five on both x and y axes. a solid line through begin ordered pair 0 comma 2 end ordered pair and begin ordered pair 4 comma negative 3 end ordered pair. a dashed line through begin ordered pair 0 comma negative 2 end ordered pair and begin ordered pair 4 comma negative 1 end ordered pair. four regions are created by the intersection of the two lines. the upper right region is the shaded region.
coordinate graph showing a range from negative seven to three on both x and y axes. a solid line through begin ordered pair 0 comma 2 end ordered pair and begin ordered pair negative 4 comma negative 3 end ordered pair. a dashed line through begin ordered pair 0 comma negative 2 end ordered pair and begin ordered pair negative 4 comma negative 3 end ordered pair. four regions are created by the intersection of the two lines. the lower left region is the shaded region.
coordinate graph showing a range of negative five to five on both x and y axes. a solid line through begin ordered pair 0 comma 2 end ordered pair and begin ordered pair negative 4 comma negative 3 end ordered pair. a dashed line through begin ordered pair 0 comma negative 2 end ordered pair and begin ordered pair 4 comma negative 1 end ordered pair. four regions are created by the intersection of the two lines. the upper left region is the shaded region.

Answers: 3


Another question on Mathematics
Mathematics, 21.06.2019 16:20
Plot the points (0,6), (3,15.8), and (9.5,0) using the graphing tool, and find the function
Answers: 2
Mathematics, 21.06.2019 17:00
Asap i need it now choose all the answers that apply. sex-linked disorders affect males more than females affect females more than males can be carried by females, without being expressed are always expressed in males are caused by genes carried on the x and y chromosomes
Answers: 1
Mathematics, 21.06.2019 20:30
3.17 scores on stats final. below are final exam scores of 20 introductory statistics students. 1 2 3 4 5 6 7 8 9 10 11 12 13 14 15 16 17 18 19 20 57, 66, 69, 71, 72, 73, 74, 77, 78, 78, 79, 79, 81, 81, 82, 83, 83, 88, 89, 94 (a) the mean score is 77.7 points. with a standard deviation of 8.44 points. use this information to determine if the scores approximately follow the 68-95-99.7% rule. (b) do these data appear to follow a normal distribution? explain your reasoning using the graphs provided below.
Answers: 1
You know the right answer?
Questions
Mathematics, 16.02.2021 05:20
Mathematics, 16.02.2021 05:20

Physics, 16.02.2021 05:20

Mathematics, 16.02.2021 05:20
Mathematics, 16.02.2021 05:20

Biology, 16.02.2021 05:20

History, 16.02.2021 05:20
Mathematics, 16.02.2021 05:20
English, 16.02.2021 05:20
Mathematics, 16.02.2021 05:20
Mathematics, 16.02.2021 05:20
Mathematics, 16.02.2021 05:20
Mathematics, 16.02.2021 05:20

Chemistry, 16.02.2021 05:20
Mathematics, 16.02.2021 05:20


