
Mathematics, 16.12.2019 02:31 dwilburn01
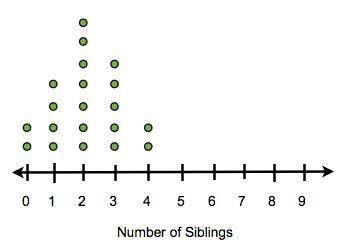
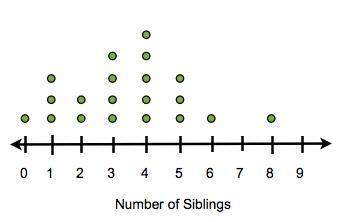
a survey of a group of seventh graders and a group of teachers at a local middle school asked how many siblings they each have. the dot plots below show the results.
based on the shape of the two dot plots, which statements correctly compare them? select three choices.
the center of the data for students has a value less than that of the center of the data for teachers.
the center of the data is to the right of the dot plot for both teachers and students.
there is a greater variation in the data for teachers than for students.
both sets of data cluster around 2.
the same number of teachers as students were surveyed.

Answers: 2


Another question on Mathematics
Mathematics, 21.06.2019 16:50
Ahiking trail is 6 miles long. it has 4 exercise stations, spaced evenly along the trail. what is the distance between each exercise station?
Answers: 3
Mathematics, 21.06.2019 18:00
Liz is shipping a package to her friend.the maximum weight of a medium flat-rate box is 20 pounds,including the box which weighs 6 ounces.write and solve an inequality to describe the possible weight ,w, of the contents that liz will ship to her friend if she must use a medium flat-rate box.
Answers: 2
Mathematics, 21.06.2019 23:50
If the tip varies directly with the number of guest which equation represents between the tip,t, and the number of guest,g?
Answers: 1
You know the right answer?
a survey of a group of seventh graders and a group of teachers at a local middle school asked how ma...
Questions

Geography, 17.12.2020 18:10
Mathematics, 17.12.2020 18:10

Chemistry, 17.12.2020 18:10

Biology, 17.12.2020 18:10

Arts, 17.12.2020 18:10
Mathematics, 17.12.2020 18:10
Arts, 17.12.2020 18:10
Chemistry, 17.12.2020 18:10


Social Studies, 17.12.2020 18:10

Mathematics, 17.12.2020 18:10
Mathematics, 17.12.2020 18:10


Health, 17.12.2020 18:10
English, 17.12.2020 18:10


