
Mathematics, 05.10.2019 17:30 kiaraahquin9546
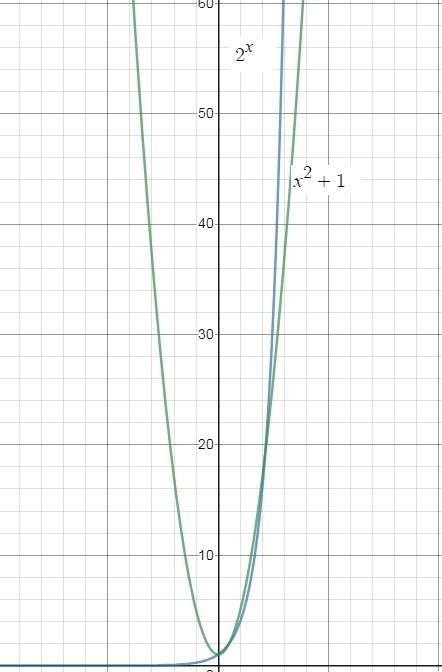
Aquadratic function and an exponential function are graphed below. which graph most likely represents the exponential function?
graph of function g of x is a curve which joins the ordered pair 0, 1 and 1, 2 and 3, 8 and 5, 32 and 6, 64. graph of function f of x is a curve which joins the ordered pair 0, 1 and 1, 2 and 3, 10 and 5, 26 and 6, 37
f(x), because an increasing quadratic function will eventually exceed an increasing exponential function
g(x), because an increasing exponential function will eventually exceed an increasing quadratic function
f(x), because an increasing exponential function will always exceeds an increasing quadratic function until their graphs intersect
g(x), because an increasing quadratic function will always exceeds an increasing exponential function until their graphs intersect

Answers: 2
 from the given points.
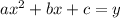
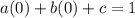

 (1)
(1)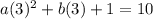
 (2)
(2)


Another question on Mathematics
Mathematics, 21.06.2019 19:30
1. are the corresponding angles congruent 2. find the ratios of the corresponding sides 3. is triangle jkl congruent to triangle rst? if so what is the scale factor
Answers: 1
Mathematics, 22.06.2019 00:10
How do i take any fraction and make it into a decimal or percentage?
Answers: 1
You know the right answer?
Aquadratic function and an exponential function are graphed below. which graph most likely represent...
Questions

History, 23.07.2019 14:00

Computers and Technology, 23.07.2019 14:00

Physics, 23.07.2019 14:00


Chemistry, 23.07.2019 14:00

Biology, 23.07.2019 14:00
Chemistry, 23.07.2019 14:00
History, 23.07.2019 14:00
Social Studies, 23.07.2019 14:00


