Hi, i really need with this problem.
1the function represents the number of specialty i...

Mathematics, 19.11.2019 06:31 shan8793
Hi, i really need with this problem.
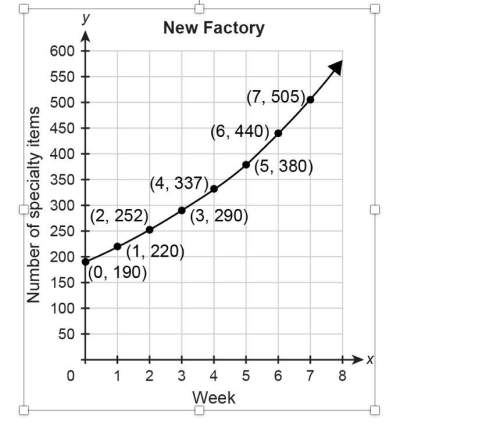
1the function represents the number of specialty items produced at the old factory w weeks after a change in management. the graph represents the number of specialty items produced at the new factory during the same time period. (a) during week 0, how many more specialty items were produced at the old factory than at the new factory? explain.
(b) which factory produced more specialty items on the 4th week? how many more items did they produce? show your work.

Answers: 2


Another question on Mathematics
Mathematics, 21.06.2019 13:30
Which point is a solution to the inequality shown in this graph (-3,-3)(3,-1)
Answers: 2
Mathematics, 22.06.2019 00:30
Anew test for ra is being developed. the test is administered to 750 patients with ra and 750 without ra. for the sake of the question, assume the prevalence of ra in this population is 50%. of the 750 patients with ra, 575 have a positive result. of the 750 patients without ra, 150 have a positive result. what is the positive predictive value of the new test? a575/(575+150) b. 600/(600+ 150) c. 575/(575+125) d. 600/(600+ 125)
Answers: 2
Mathematics, 22.06.2019 04:30
Which of the following is the correct solution to the linear inequality shown below? y< 1/2x-4
Answers: 2
You know the right answer?
Questions
Mathematics, 28.01.2020 17:00

History, 28.01.2020 17:00
Mathematics, 28.01.2020 17:00

English, 28.01.2020 17:00

Chemistry, 28.01.2020 17:00

Mathematics, 28.01.2020 17:00

Mathematics, 28.01.2020 17:00
Mathematics, 28.01.2020 17:00

Computers and Technology, 28.01.2020 17:00
Mathematics, 28.01.2020 17:00
Mathematics, 28.01.2020 17:00


