The graph below shows the velocity f(t) of a runner during a certain time interval:
gra...

Mathematics, 16.11.2019 01:31 hana560
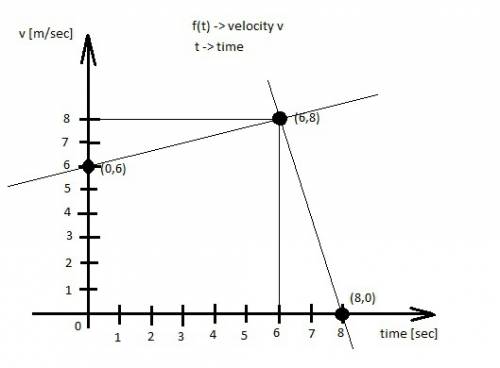
The graph below shows the velocity f(t) of a runner during a certain time interval:
graph of line segment going through ordered pairs 0, 6 and 6, 8. graph of another line segment going through the ordered pairs 6, 8 and 8, 0. label on the x axis is time in seconds and label on the y axis is velocity in meters per second
which of the following describes the intercepts on the graph?
the initial acceleration of the runner was 8 m/s2, and the runner stopped after 6 seconds.
the initial acceleration of the runner was 6 m/s2, and the runner stopped after 8 seconds.
the initial velocity of the runner was 8 m/s, and the runner stopped after 6 seconds.
the initial velocity of the runner was 6 m/s, and the runner stopped after 8 seconds.

Answers: 2


Another question on Mathematics
Mathematics, 21.06.2019 19:10
Which situation can be modeled by the inequality 5 + 10w ≥ 45? a. you start with $5 and save $10 a week until you have at least $45. b.you start with 5 baseball cards and purchase 10 cards every week until you have at most 45 cards. c.you start with 5 water bottles and purchases cases of 10 water bottles each until you have a total of 45 water bottles. d.you spend $5 plus $10 per week until you have less than $45.
Answers: 3
You know the right answer?
Questions


English, 28.06.2019 08:00

Mathematics, 28.06.2019 08:00

Social Studies, 28.06.2019 08:00
History, 28.06.2019 08:00
Mathematics, 28.06.2019 08:00

English, 28.06.2019 08:00

World Languages, 28.06.2019 08:00
Mathematics, 28.06.2019 08:00


