
Mathematics, 18.11.2019 23:31 jwyapo4
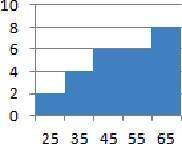
In a survey, 26 voters were asked their ages. the results are shown below. given a lower class limit of 20 and a class width of 10, which histogram correctly represents the data?
43 66 56 45 28 21 63 35 67 49 66 32 52 53 48 61 37 53 51 69 40 31 60 48 62 59
i already know the answer but i need someone to explain to me how to get to the answer.
(see attachments for answers)

Answers: 1


Another question on Mathematics
Mathematics, 21.06.2019 17:30
Arecipe uses 2 cups of sugar to make 32 brownies. how many cups of sugar are needed to make 72 brownies?
Answers: 1
Mathematics, 21.06.2019 18:30
Agraphic designer created a logo on eight and a half by 11 inch paper. in order to be placed on a business card, the logo needs to be one and 7/10 inches by 2 and 1/5 in. what is the scale factor of the dilation
Answers: 1
Mathematics, 21.06.2019 22:30
What is 100,000 times 1/100,000, using the standard method of multiplication? write the answer as 10 to a power.
Answers: 1
Mathematics, 22.06.2019 01:20
Me i'm timed ! a. -2 to 1 b. -1.5 to 0.5c. 0 to 1d. 0.5 to 1.5
Answers: 2
You know the right answer?
In a survey, 26 voters were asked their ages. the results are shown below. given a lower class limit...
Questions
Mathematics, 16.10.2020 08:01
Mathematics, 16.10.2020 08:01

Social Studies, 16.10.2020 08:01
Social Studies, 16.10.2020 08:01


English, 16.10.2020 08:01
English, 16.10.2020 08:01
Social Studies, 16.10.2020 08:01
English, 16.10.2020 08:01

History, 16.10.2020 08:01
History, 16.10.2020 08:01


