
Mathematics, 15.11.2019 23:31 marvinc5603
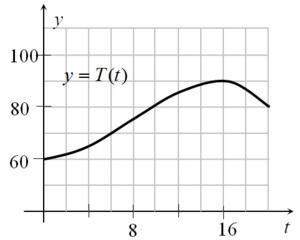
The image shows the graph of t , the temperature (in fahrenheit) over a 20-hour period in peach tree city as a function of time t.
1. estimate t(10).
2. if t=0 corresponds to 12: 00 midnight, interpret what is meant by t(12) in words.
3. estimate the highest temperature during this period from the graph.
4. when was the temperature decreasing?
5. if taylor swift wants to go for a two-hour hike and return before the temperature gets over 70 degrees, when should she leave?

Answers: 3


Another question on Mathematics
Mathematics, 21.06.2019 16:00
Data are collected to see how many ice-cream cones are sold at a ballpark in a week. day 1 is sunday and day 7 is the following saturday. use the data from the table to create a scatter plot.
Answers: 2
Mathematics, 21.06.2019 17:00
The size of a certain cell is 2.5*10^-9m. another cell is 1.5*10^3 times larger. how large is the larger cell in scientific notation?
Answers: 2
Mathematics, 21.06.2019 17:30
Choose the number sentence that shows the identity property of addition. a. 122 = 61 + 61 b. 62 = 1 + 61 c. 61 = 0 + 61
Answers: 1
You know the right answer?
The image shows the graph of t , the temperature (in fahrenheit) over a 20-hour period in peach tree...
Questions

Social Studies, 27.10.2021 01:00
Mathematics, 27.10.2021 01:00


Mathematics, 27.10.2021 01:00
Social Studies, 27.10.2021 01:00
Mathematics, 27.10.2021 01:00

Physics, 27.10.2021 01:00
Physics, 27.10.2021 01:00
Mathematics, 27.10.2021 01:00

Mathematics, 27.10.2021 01:00

SAT, 27.10.2021 01:00
Mathematics, 27.10.2021 01:00
Chemistry, 27.10.2021 01:00


