
Mathematics, 11.11.2019 21:31 Mathmatician22
Afood truck did a daily survey of customers to find their food preferences. the data is partially entered in the frequency table. complete the table to analyze the data and answer the questions:
likes hamburgers does not like hamburgers total
likes burritos 38 77
does not like burritos 95 128
total 134 71
part a: what percentage of the survey respondents did not like either hamburgers or burritos? (2 points)
part b: create a relative frequency table and determine what percentage of students who like hamburgers also like burritos. (3 points)
part c: use the conditional relative frequencies to determine which two data point has strongest association of its two factors. use complete sentences to explain your answer. (5 points)
question 3 (essay worth 10 points)
(05.07 mc)
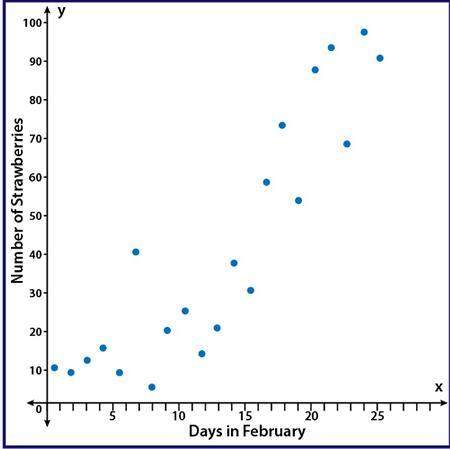
the scatter plot shows the number of strawberries that have been picked on the farm during the month of february:
a scatter plot with points showing an upward trend with points that are moderately spread out from a line of best fit. the y axis is labeled number of strawberries and the x axis is labeled days in february
part a: using computer software, a correlation coefficient of r = 0.01 was calculated. based on the scatter plot, is that an accurate value for this data? why or why not? (5 points)
part b: instead of comparing the number of strawberries picked and the day in february, write a scenario that would be a causal relationship for strawberries picked on the farm. (5 points)

Answers: 3


Another question on Mathematics
Mathematics, 21.06.2019 15:00
There were 816 people at a concert when a band started to play. after each song, only half the people stayed to hear the next song. how many people were left at the concert after x songs? write a function to represent this scenario.
Answers: 3
Mathematics, 21.06.2019 17:30
The jewelry store is having a sale. necklaces that were regularly priced at $23.50 are on sale for $18.80. what is the percentage of decrease in the price of necklaces?
Answers: 1
Mathematics, 21.06.2019 18:00
Find the slope and the y-intercept if there's one and the equation of the line given these two points( 3, 2) and( 3, -4)
Answers: 2
Mathematics, 21.06.2019 19:30
James was playing a game with his friends. he won 35 points. then he lost 15, lost 40 and won 55. how did he come out
Answers: 2
You know the right answer?
Afood truck did a daily survey of customers to find their food preferences. the data is partially en...
Questions

Mathematics, 12.01.2021 21:00

Business, 12.01.2021 21:00

English, 12.01.2021 21:00
Mathematics, 12.01.2021 21:00
Mathematics, 12.01.2021 21:00

History, 12.01.2021 21:00
Mathematics, 12.01.2021 21:00
English, 12.01.2021 21:00
Mathematics, 12.01.2021 21:00


Chemistry, 12.01.2021 21:00
History, 12.01.2021 21:00
English, 12.01.2021 21:00


