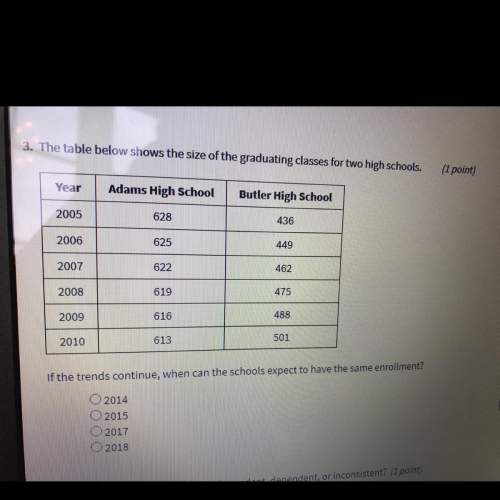
The table below shows the size of the graduating classes for two high schools.
year | sc...

Mathematics, 28.10.2019 18:31 gabesurlas
The table below shows the size of the graduating classes for two high schools.
year | school a | school b
2005 628 436
2006 625 449
2007 622 462
2008 619 475
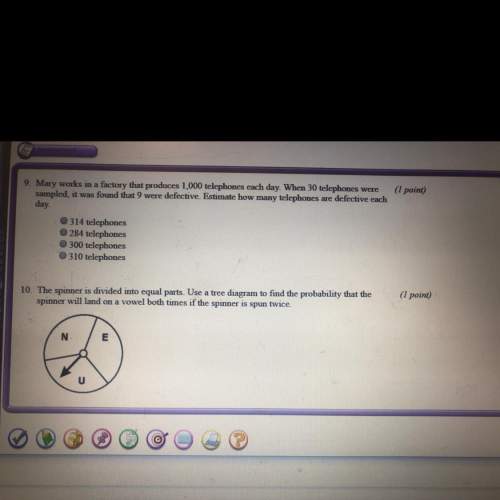
2009 616 48
2010 613 501
if the trends continue, when can the schools expect to have the same enrollment?
a. 2014
b. 2015
c. 2017
d. 2018

Answers: 3


Another question on Mathematics
Mathematics, 21.06.2019 18:50
Jermaine has t subway tokens. karen has 4 more subway tokens than jermaine. raul has 5 fewer subway tokens than jermaine. which expression represents the ratio of karen's tokens to raul's tokens
Answers: 1
Mathematics, 21.06.2019 21:00
Evaluate this using ! 0.25^2 x 2.4 + 0.25 x 2.4^2 − 0.25 x 2.4 x 0.65
Answers: 1
Mathematics, 21.06.2019 21:30
Find the unit rate for: 75% high-fiber chimp food to 25% high -protein chimp food.
Answers: 2
Mathematics, 22.06.2019 00:00
Answer asap! show all work! find the number of complex roots, the possible number of real roots and the possible rational roots of the polynomial function. then, solve for all roots. x^3 + 2x^2 + 3x + 6 = 0
Answers: 1
You know the right answer?
Questions


Social Studies, 05.02.2021 01:00

Mathematics, 05.02.2021 01:00

Mathematics, 05.02.2021 01:00

Mathematics, 05.02.2021 01:00

Mathematics, 05.02.2021 01:00

Advanced Placement (AP), 05.02.2021 01:00

Chemistry, 05.02.2021 01:00
Mathematics, 05.02.2021 01:00


