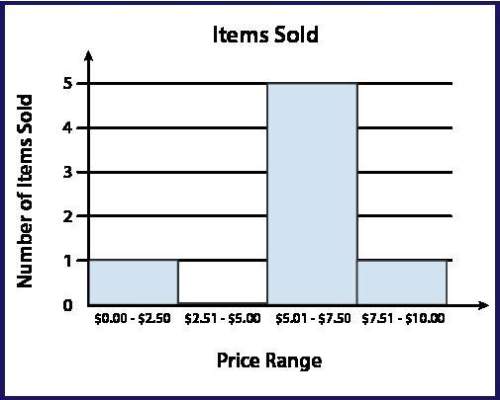
The following histogram shows the number of items sold at a grocery store at various prices:
<...

Mathematics, 27.10.2019 10:43 Lindy4886
The following histogram shows the number of items sold at a grocery store at various prices:
histogram titled items sold with price range on the x axis and number of items sold on the y axis. bar 1 is 0 to 2 dollars and 50 cents and has a height of 1. bar 2 is 2 dollars and 51 cents to 5 dollars and has a height of 0. bar 3 is 5 dollars and 1 cent to 7 dollars and 50 cents and has a height of 5. bar 4 is 7 dollars and 51 cents to 10 dollars and has a height of 1.
which of the following data sets is represented in the histogram?
{1, 0, 5, 1}
{0.99, 5.01, 5.25, 6.79, 6.99, 7.50, 7.51}
{0.75, 2.50, 7.50, 7.50, 7.50, 7.50, 10.00}
{2.50, 2.51, 5.00, 5.01, 7.50, 7.51, 10.00}

Answers: 3


Another question on Mathematics
Mathematics, 21.06.2019 18:30
Two cyclists 84 miles apart start riding toward each other at the samen time. one cycles 2 times as fast as the other. if they meet 4 hours later what is the speed (in miles) of the faster cyclists
Answers: 2
Mathematics, 21.06.2019 22:20
Given the following linear function sketch the graph of the function and find the domain and range. ƒ(x) = -5x + 4
Answers: 2
Mathematics, 22.06.2019 01:00
How many zeros does this polynomial function, y=(x-8)(x+3)^2
Answers: 1
You know the right answer?
Questions

Mathematics, 27.08.2021 17:10
Biology, 27.08.2021 17:10
Biology, 27.08.2021 17:10

Mathematics, 27.08.2021 17:10

Geography, 27.08.2021 17:20
Mathematics, 27.08.2021 17:20


Chemistry, 27.08.2021 17:20
Mathematics, 27.08.2021 17:20


English, 27.08.2021 17:20


