Which explains whether or not the graph represents a direct variation?
the graph has a...

Mathematics, 14.10.2019 11:30 Callmetay24
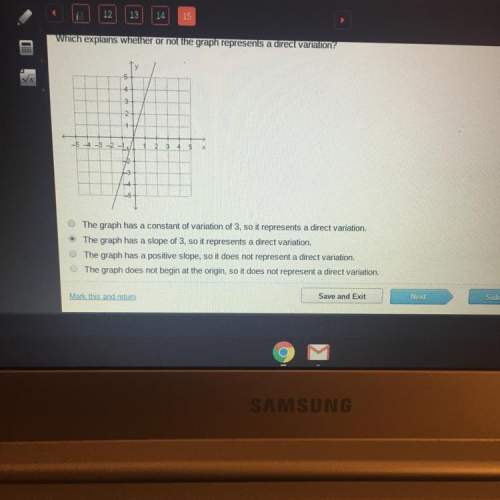
Which explains whether or not the graph represents a direct variation?
the graph has a constant of variation of 3, so it represents a direct variation.
the graph has a slope of 3, so it represents a direct variation.
the graph has a positive slope, so it does not represent a direct variation.
the graph does not begin at the origin, so it does not represent a direct variation.

Answers: 1


Another question on Mathematics
Mathematics, 21.06.2019 15:00
Achemist has 200 ml of a 10% sucrose solution. she adds x ml of a 40% sucrose solution. the percent concentration, y, of the final mixture is given by the rational function: the chemist needs the concentration of the final mixture to be 30%. how many milliliters of the 40% solution should she add to the 10% solution to get this concentration?
Answers: 1
Mathematics, 21.06.2019 16:00
Answer asap ! the shortest path from point a to point b goes through a pond. to avoid the pond, you must walk straight 34 meters along one edge of the pond, then take a 90 degree turn, and again walk straight 41 meters along another edge of the pond to reach point b. about how many meters would be saved if it were possible to walk through the pond? a. 11 m b. 20 m c. 30.45 m d. 21.73 m
Answers: 1
Mathematics, 21.06.2019 19:00
John used linear combination to solve the system of equations shown. he did so by multiplying the first equation by -3 and the second equation by another number to eliminate the x-terms. what number did jonas multiply the second equation by? 4x-6y=23x+5y=11
Answers: 2
You know the right answer?
Questions

Mathematics, 22.04.2020 23:15

English, 22.04.2020 23:15

Biology, 22.04.2020 23:15

Spanish, 22.04.2020 23:15

Mathematics, 22.04.2020 23:15
English, 22.04.2020 23:16


Computers and Technology, 22.04.2020 23:16


