
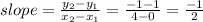
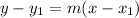
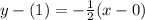


 -----> the y-intercept is the point (0,1)
Which linear function is represented by the graph?
f(x) = –2x + 1
f(x) = –f(x) eq...

Mathematics, 14.10.2019 02:20 natalie2sheffield
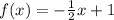
Which linear function is represented by the graph?
f(x) = –2x + 1
f(x) = –f(x) equals negative startfraction one-half endfraction x plus 1.x + 1
f(x) = f(x) equals startfraction one-half endfraction x plus 1.x + 1
f(x) = 2x + 1


Answers: 3


Another question on Mathematics
Mathematics, 21.06.2019 17:00
The size of a certain cell is 2.5*10^-9m. another cell is 1.5*10^3 times larger. how large is the larger cell in scientific notation?
Answers: 2
Mathematics, 21.06.2019 21:30
Acoffee shop orders at most $3,500 worth of coffee and tea. the shop needs to make a profit of at least $1,900 on the order. the possible combinations of coffee and tea for this order are given by this system of inequalities, where c = pounds of coffee and t = pounds of tea: 6c + 13t ≤ 3,500 3.50c + 4t ≥ 1,900 which graph's shaded region represents the possible combinations of coffee and tea for this order?
Answers: 1
Mathematics, 21.06.2019 22:30
Need this at the city museum, child admission is 6 and adult admission is 9.20. on tuesday, 132 tickets were sold for a total sales of 961.60. how many adult tickets were sold that day?
Answers: 1
Mathematics, 21.06.2019 23:00
1. an economy consists of three workers: larry, moe, and curly. each works 10 hours a day and can produce two services: mowing lawns and washing cars. in an hour, larry can either mow one lawn or wash one car; moe can either mow one lawn or wash two cars; and curly can either mow two lawns or wash one car. a. calculate how much of each service is produced under the following circumstances: a. all three spend all their time mowing lawns. b. all three spend all their time washing cars. c. all three spend half their time on each activity d. larry spends half of his time on each activity, while moe only washes cars and curly only mows lawns b. using your answers to part a, draw a production possibilities frontier and label points a, b, c, and d on your graph. explain why the production possibilities frontier has the shape it does. c. are any of the allocations calculated in part a inefficient? explain.
Answers: 3
You know the right answer?
Questions

Advanced Placement (AP), 15.11.2020 04:10

English, 15.11.2020 04:10
English, 15.11.2020 04:10
Mathematics, 15.11.2020 04:10
Mathematics, 15.11.2020 04:10

Physics, 15.11.2020 04:10
Mathematics, 15.11.2020 04:10
Physics, 15.11.2020 04:10

English, 15.11.2020 04:10
Mathematics, 15.11.2020 04:10
Mathematics, 15.11.2020 04:10
Physics, 15.11.2020 04:10

Chemistry, 15.11.2020 04:10

World Languages, 15.11.2020 04:10
English, 15.11.2020 04:10
Mathematics, 15.11.2020 04:10
History, 15.11.2020 04:10
English, 15.11.2020 04:10
History, 15.11.2020 04:10


