
Mathematics, 03.10.2019 10:30 monkeys450
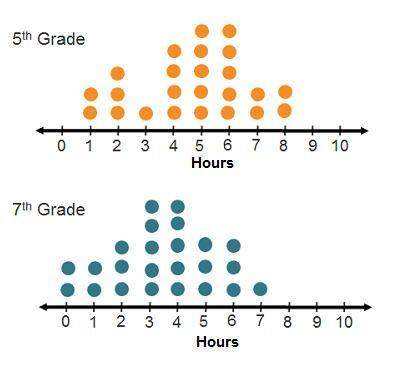
The dot plots show the number of hours a group of fifth graders and seventh graders spent playing outdoors over a one-week period.
time spent playing outdoors
for fifth graders and seventh graders
which statement correctly compares the shape of the data in the plots?
both sets of data have a peak at 5 hours and 6 hours.
the left side of the data looks similar to the right side in the seventh-grade data, but not in the fifth-grade data.
in both sets, the data cluster around 3 hours.
there is a gap in the fifth-grade data, but not in the seventh-grade data.

Answers: 3


Another question on Mathematics
Mathematics, 21.06.2019 16:30
Consider 6x2 + 6x + 1. which term immediately tells you that this expression is not a perfect square trinomial? justify your answer
Answers: 2
Mathematics, 21.06.2019 21:00
Need match the functions with correct transformation. f(x) = -3x f(x) = |x-1|+3 f(x) = √(x+3) 1/2x² f(x) = (x+1)²-3 4|x| 1. compress by a factor of 1/2 2. stretch by a factor of 4 3. shift to the left 3 4. shift to the left 1 5. shift up 3 6. reflection
Answers: 1
Mathematics, 21.06.2019 22:00
Which statements describe the solutions to the inequality x< -20 check all that apply. there are infinite solutions. each solution is negative. each solution is positive. the solutions are both positive and negative. the solutions contain only integer values. the solutions contain rational number values.
Answers: 1
Mathematics, 21.06.2019 22:30
Which answer goes into the box? (90° clockwise rotation, 90° counter clockwise rotation, translation, or glide reflection)
Answers: 2
You know the right answer?
The dot plots show the number of hours a group of fifth graders and seventh graders spent playing ou...
Questions


Physics, 04.02.2020 10:43

Health, 04.02.2020 10:43

Social Studies, 04.02.2020 10:43
Mathematics, 04.02.2020 10:43


History, 04.02.2020 10:43
History, 04.02.2020 10:43


Arts, 04.02.2020 10:43
History, 04.02.2020 10:43


