Which inequality does the given graph represent?
a) y > x + 2
b) y ≤ −x − 2
...

Mathematics, 30.09.2019 20:30 aylengarcia090
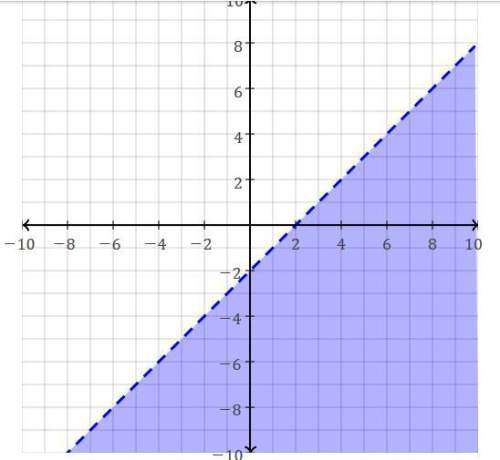
Which inequality does the given graph represent?
a) y > x + 2
b) y ≤ −x − 2
c) y < x − 2
d) y ≥ x − 1/2

Answers: 2


Another question on Mathematics
Mathematics, 21.06.2019 18:30
How do you create a data set with 8 points in it that has a mean of approximately 10 and a standard deviation of approximately 1?
Answers: 1
Mathematics, 21.06.2019 19:00
Identify the conclusion of the conditional statement. if you live in phoenix, then you live in arizona.
Answers: 1
Mathematics, 21.06.2019 21:00
Two florida panthers were weighed. one weighs 6x+21 pounds and the two together weigh 14x+11 pounds how much does he other panther weigh alone
Answers: 1
You know the right answer?
Questions


Computers and Technology, 25.02.2020 17:00


English, 25.02.2020 17:01
Computers and Technology, 25.02.2020 17:01
Biology, 25.02.2020 17:01


