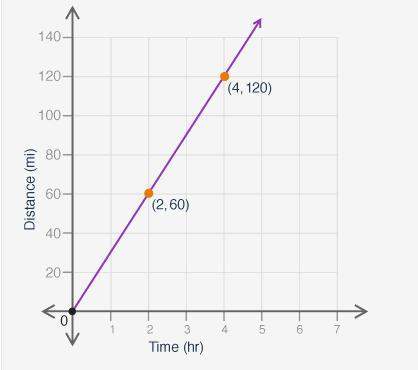
The graph shows the distance a car traveled, y, in x hours:
a coordinate plane graph is shown...

Mathematics, 24.09.2019 21:30 nickespinosa11
The graph shows the distance a car traveled, y, in x hours:
a coordinate plane graph is shown. the x-axis is labeled time in hours ,and the y-axis is labeled distance in miles. the line passes through the points 2 comma 60, and 4 comma 120.
what is the rise-over-run value for the relationship represented in the graph?
20
30
1 over 20
1 over 30

Answers: 2


Another question on Mathematics
Mathematics, 21.06.2019 17:00
Line gh passes through points (2, 5) and (6, 9). which equation represents line gh? y = x + 3 y = x – 3 y = 3x + 3 y = 3x – 3
Answers: 1
Mathematics, 21.06.2019 20:30
Venita is sewing new curtains. the table below shows the relationship between the number of stitches in a row and the length ofthe row.sewingnumber of stitches length (cm)51 131532024306what is the relationship between the number of stitches and the length? othe number of stitches istimes the length.o. the number of stitches is 3 times the length.
Answers: 2
Mathematics, 21.06.2019 21:00
Need match the functions with correct transformation. f(x) = -3x f(x) = |x-1|+3 f(x) = √(x+3) 1/2x² f(x) = (x+1)²-3 4|x| 1. compress by a factor of 1/2 2. stretch by a factor of 4 3. shift to the left 3 4. shift to the left 1 5. shift up 3 6. reflection
Answers: 1
You know the right answer?
Questions

History, 30.11.2019 11:31

Mathematics, 30.11.2019 11:31

Social Studies, 30.11.2019 11:31
Mathematics, 30.11.2019 11:31

Chemistry, 30.11.2019 11:31

History, 30.11.2019 11:31

Mathematics, 30.11.2019 11:31
Social Studies, 30.11.2019 11:31

Spanish, 30.11.2019 11:31


