


The line plot shows the ages of people taking a driving test at a certain station one day.
wha...

Mathematics, 29.08.2019 20:00 bnn29
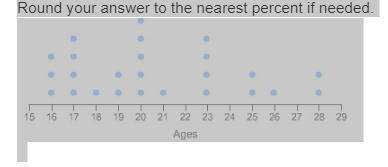
The line plot shows the ages of people taking a driving test at a certain station one day.
what percent of the people are 18 or younger?
round your answer to the nearest percent if needed.
a line plot titled ages from 15 to 29. the plot displays the following values as dots above the corresponding value on the number line. three dots at 16. four dots at 17. one dot at 18. two dots at 19. five dots at 20. one dot at 21. four dots at 23. two dots at 25. one dot at 26. two dots at 28.
32%
28%
25%
17%

Answers: 3


Another question on Mathematics
Mathematics, 21.06.2019 17:30
Colby and jaquan are growing bacteria in an experiment in a laboratory. colby starts with 50 bacteria in his culture and the number of bacteria doubles every 2 hours. jaquan starts with 80 of a different type of bacteria that doubles every 3 hours. let x equal number of days. colbys experiment follows the model: a.) y=50*2^x b.) y=50*2^8x c.) y=50*2^12x jaquans experiment follows the model: a.)80*2^x b.)80*2^8x c.)80*2^12x
Answers: 3
Mathematics, 21.06.2019 18:00
What are the equivalent ratios for 24/2= /3= /5.5=108/ = /15
Answers: 1
Mathematics, 21.06.2019 19:00
Abacteria population is tripling every hour. by what factor does the population change in 1/2 hour? select all that apply
Answers: 1
You know the right answer?
Questions

Social Studies, 22.05.2021 05:30
Mathematics, 22.05.2021 05:30


Biology, 22.05.2021 05:30
Mathematics, 22.05.2021 05:30
Mathematics, 22.05.2021 05:30
Mathematics, 22.05.2021 05:30

Health, 22.05.2021 05:30

Computers and Technology, 22.05.2021 05:30

Chemistry, 22.05.2021 05:30
Mathematics, 22.05.2021 05:40
Mathematics, 22.05.2021 05:40
Social Studies, 22.05.2021 05:40
Mathematics, 22.05.2021 05:40


