
Mathematics, 13.08.2019 12:10 mandoux
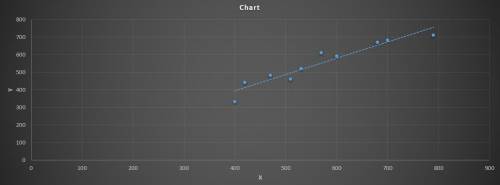
The sat math scores, x, and sat verbal scores, y, for ten high school students are shown in the table below.
x y
400 330
420 440
470 480
510 460
530 520
570 610
600 590
680 670
700 680
790 710
using a residual plot, determine if the following model is a good fit for the data in the table above.
no. the model is not a good fit because the residual plot has a random pattern.
yes. the model is a good fit because the residual plot has a random pattern.
no. the model is not a good fit because the residual plot does not have a random pattern.
yes. the model is a good fit because the residual plot does not have a random pattern.

Answers: 2


Another question on Mathematics
Mathematics, 21.06.2019 22:30
Using the figure below, select the two pairs of alternate interior angles.a: point 1 and point 4 b : point 2 and point 3 c: point 6 and point 6d: point 5 and point 7
Answers: 2
Mathematics, 22.06.2019 03:30
Tom and lilly rented a house for $12,000 last year. at the start of the year they bought the house they had been renting directly from the owner for $250,000. they believe they could rent it for $12,000 this year, but stay in the house. how much does tom and lilly’s decision to buy the house change gdp? a. it reduces gdp by $12,000 b. it does not change gdp c. it raises gdp by $238,000 d. it raises gdp by $250,000
Answers: 1
Mathematics, 22.06.2019 04:10
Can you explain how a table can be used to find a rate of change?
Answers: 2
Mathematics, 22.06.2019 05:00
In the triangle below, what is the length of the side opposite the 60° angle?
Answers: 1
You know the right answer?
The sat math scores, x, and sat verbal scores, y, for ten high school students are shown in the tabl...
Questions

English, 29.11.2021 08:20
Mathematics, 29.11.2021 08:20


Chemistry, 29.11.2021 08:20
Mathematics, 29.11.2021 08:20

Social Studies, 29.11.2021 08:20

Mathematics, 29.11.2021 08:30


