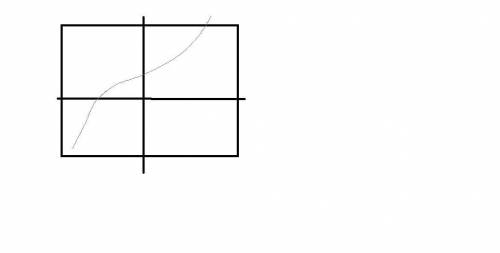
Which best describes the graph of the cubic function f(x) = x^3 +x^2 +x +1?
a. x increases, y...

Mathematics, 15.07.2019 20:20 Angelofpink2590
Which best describes the graph of the cubic function f(x) = x^3 +x^2 +x +1?
a. x increases, y increases along the entire graph.
b. as x increases, y increases, decreases, and then increases again.
c. as x increases, y decreases, increases and then decreases again.
d. as x increases, y decrease along the entire graph.

Answers: 2


Another question on Mathematics
Mathematics, 21.06.2019 23:00
Afamily went out to dinner and their bill was $113.if they want to leave a 19% tip, how much should they leave.
Answers: 2
Mathematics, 21.06.2019 23:30
On this question. a hypothermia occurs when a person's body temperature drops below 95 degrees fahrenheit. write and solve an inequality that describes how much lower the body temperature of a person with hypothermia will be than the body temperature of a person with a normal temperature of 98.6 degrees fahrenheit
Answers: 1
Mathematics, 21.06.2019 23:30
If a runner who runs at a constant speed of p miles per hour runs a mile in exactly p minutes what is the integer closest to the value p
Answers: 2
Mathematics, 22.06.2019 00:30
Ahovercraft takes off from a platform. its height (in meters), xx seconds after takeoff, is modeled by: h(x)=-2x^2+20x+48h(x)=−2x 2 +20x+48 what is the maximum height that the hovercraft will reach?
Answers: 3
You know the right answer?
Questions

Mathematics, 04.04.2020 01:34


Business, 04.04.2020 01:34

Geography, 04.04.2020 01:34
English, 04.04.2020 01:34
Mathematics, 04.04.2020 01:34


