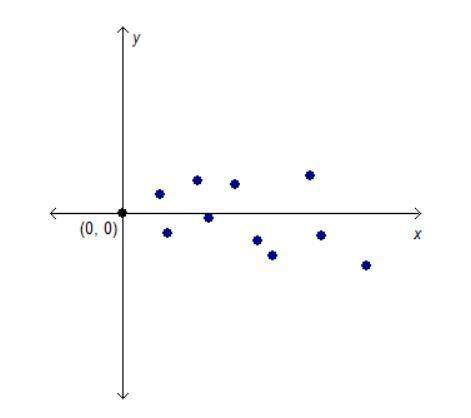
Consider the plot created from the residuals of a line of best fit for a set of data.
does the...

Mathematics, 10.07.2019 05:20 jaidyn3mccoy6
Consider the plot created from the residuals of a line of best fit for a set of data.
does the residual plot show that the line of best fit is appropriate for the data?
yes, the points have no pattern.
no, the points are evenly distributed about the x-axis.
no, the points are in a linear pattern.
yes, the points are in a curved pattern.

Answers: 2


Another question on Mathematics
Mathematics, 21.06.2019 16:00
()1. how do you find range? 2.the following set of data is to be organized into a histogram. if there are to be five intervals on the graph, what should the length of each interval be? 30, 34, 23, 21, 27, 25, 29, 29, 25, 23, 32, 31
Answers: 1
Mathematics, 21.06.2019 20:30
Find the nonpermissible replacement for binthis expression.b2/5b +5
Answers: 1
Mathematics, 22.06.2019 00:30
Simplify the given expression leaving the answer in improper fraction form. 2/3+5/6
Answers: 2
Mathematics, 22.06.2019 01:40
Amass weighing 16 pounds stretches a spring 8/3 feet. the mass is initially released from rest from a point 2 feet below the equilibrium position, and the subsequent motion takes place in a medium that offers a damping force that is numerically equal to 1/2 the instantaneous velocity. find the equation of motion if the mass is driven by an external force equal to f(t)=cos(2t).
Answers: 2
You know the right answer?
Questions
Mathematics, 16.09.2021 22:50


Chemistry, 16.09.2021 22:50

Mathematics, 16.09.2021 22:50

Social Studies, 16.09.2021 22:50

Biology, 16.09.2021 22:50
Chemistry, 16.09.2021 23:00


