
Mathematics, 26.06.2019 06:10 kdobi
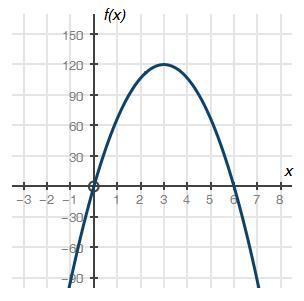
The graph below shows a company’s profit f(x), in dollars, depending on the price of pens x, in dollars being sold to the company:
part a: what do the x-intercepts and maximum value of the graph represent? what are the intervals where the function is increasing and decreasing, and what do they represent about the sale and profit?
part b: what is an approximate average rate of change of the graph from x = 3 and x = 5, and what does this rate represent?

Answers: 2


Another question on Mathematics
Mathematics, 20.06.2019 18:02
Kelly is three years younger than her sister. the sum of their ages is 34 years. how old is kelly and how old is her sister?
Answers: 1
Mathematics, 21.06.2019 13:20
Figure lmno is located at l (1, 1), m (4, 4), n (7, 1), and o (4, −2). use coordinate geometry to best classify quadrilateral lmno.
Answers: 3
Mathematics, 21.06.2019 16:00
The graph shows the distance y, in inches, a pendulum moves to the right (positive displacement) and to the left (negative displacement), for a given number of seconds x. how many seconds are required for the pendulum to move from its resting position and return? enter your answer in the box.
Answers: 2
Mathematics, 21.06.2019 17:10
The graph of g(x) is a translation of y = which equation represents g(x)?
Answers: 1
You know the right answer?
The graph below shows a company’s profit f(x), in dollars, depending on the price of pens x, in doll...
Questions

Biology, 23.03.2020 23:57

Mathematics, 23.03.2020 23:57
Engineering, 23.03.2020 23:57

Mathematics, 23.03.2020 23:57

History, 23.03.2020 23:57

World Languages, 23.03.2020 23:57
History, 23.03.2020 23:57
History, 23.03.2020 23:57
Mathematics, 23.03.2020 23:57


