The tables below show four sets of data:
set a
x 1 2 3 4 5 6 7 8 9
y 10...

Mathematics, 10.12.2019 17:31 lclaudettecarte8346
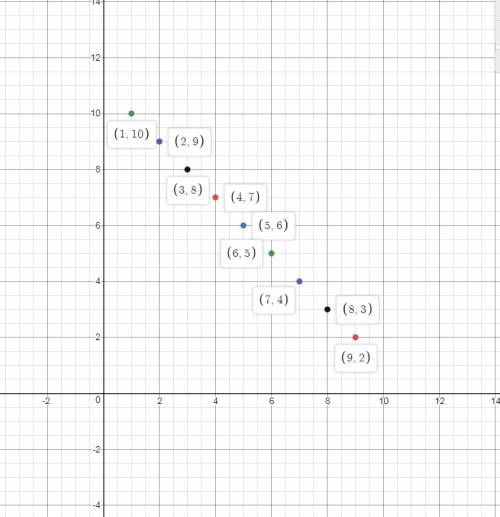
The tables below show four sets of data:
set a
x 1 2 3 4 5 6 7 8 9
y 10 9 8 7 6 5 4 3 2
set b
x 1 2 3 4 5 6 7 8 9
y 3 4 5 6 7 8 9 10 11
set c
x 1 2 3 4 5 6 7 8 9
y 8 6 5 4 3.5 3 2.5 2 2
set d
x 1 2 3 4 5 6 7 8 9
y 1 2.5 2.5 3 4 5 6 8 9
for which set of data will the scatter plot represent a negative linear association between x and y? (4 points)
set a
set b
set c
set d

Answers: 2


Another question on Mathematics
Mathematics, 21.06.2019 14:30
Sadie computes the perimeter of a rectangle by adding the length, l, and width, w, and doubling this sum. eric computes the perimeter of a rectangle by doubling the length, l, doubling the width, w, and adding the doubled amounts. write an equation for sadie’s way of calculating the
Answers: 3
Mathematics, 21.06.2019 19:30
Evaluate the expression for the given value of the variable. ∣-4b-8∣+∣-1-b^2 ∣+2b^3 ; b=-2
Answers: 2
You know the right answer?
Questions
SAT, 08.03.2021 19:30

Social Studies, 08.03.2021 19:30


Mathematics, 08.03.2021 19:30

Geography, 08.03.2021 19:30
Mathematics, 08.03.2021 19:30
Mathematics, 08.03.2021 19:30

Mathematics, 08.03.2021 19:30

World Languages, 08.03.2021 19:30
Mathematics, 08.03.2021 19:30


