Use technology or a z-distribution table to find the indicated area.
suppose ages of car...

Mathematics, 25.01.2020 09:31 daniecott
Use technology or a z-distribution table to find the indicated area.
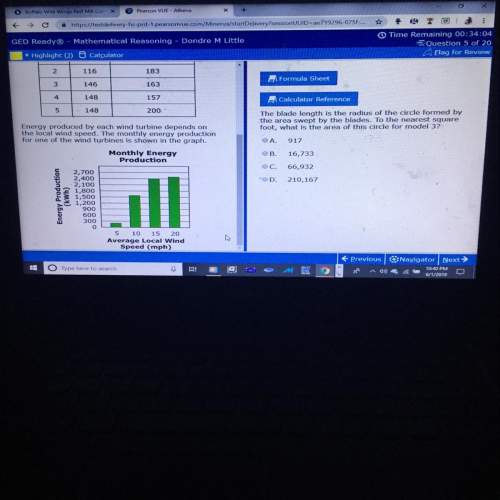
suppose ages of cars driven by company employees are normally distributed with a mean of 8 years and a standard deviation of 3.2 years.
approximately 75% of cars driven by company employees are older than what age?
a. 2.1
b. 4.8
c. 5.9
d. 10.2

Answers: 2


Another question on Mathematics
Mathematics, 21.06.2019 23:30
The number of members f(x) in a local swimming club increased by 30% every year over a period of x years. the function below shows the relationship between f(x) and x: f(x) = 10(1.3)xwhich of the following graphs best represents the function? graph of f of x equals 1.3 multiplied by 10 to the power of x graph of exponential function going up from left to right in quadrant 1 through the point 0, 0 and continuing towards infinity graph of f of x equals 10 multiplied by 1.3 to the power of x graph of f of x equals 1.3 to the power of x
Answers: 1
Mathematics, 22.06.2019 01:00
The table shown below gives the approximate enrollment at the university of michigan every fifty years. how many more students were enrolled at the university of michigan in 1950 than in 1900?
Answers: 3
You know the right answer?
Questions


Mathematics, 26.08.2019 01:50
Mathematics, 26.08.2019 01:50
Mathematics, 26.08.2019 01:50


History, 26.08.2019 01:50
Mathematics, 26.08.2019 01:50

Biology, 26.08.2019 01:50
History, 26.08.2019 01:50
History, 26.08.2019 01:50
Mathematics, 26.08.2019 01:50


