Make a box-and-whisker plot of the data.
29, 21, 17, 10, 15, 27, 22, 30...

Mathematics, 29.01.2020 16:54 rheamorrell
Make a box-and-whisker plot of the data.
29, 21, 17, 10, 15, 27, 22, 30

Answers: 2


Another question on Mathematics
Mathematics, 21.06.2019 15:30
The function ƒ is defined by ƒ(x) = (x + 3)(x + 1). the graph of ƒ in the xy-plane is a parabola. which interval contains the x-coordinate of the vertex of the graph of ƒ?
Answers: 2
Mathematics, 21.06.2019 16:00
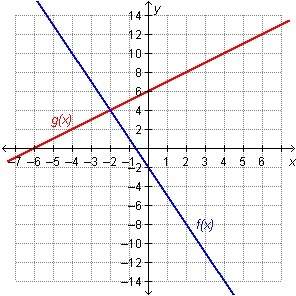
The graph shows the function f(x) = (2.5)x was horizontally translated left by a value of h to get the function g(x) = (2.5)x–h.
Answers: 1
You know the right answer?
Questions


Mathematics, 15.01.2020 20:31


