
 we have
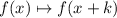 translates the function horizontally, k units to the left if k is positive, k units to the right if k is negative.
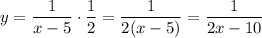
 scales the function vertically. The function is squeezed by a factor k if k is between 0 and 1, and it is stretched by a factor k if k is greater than 1.
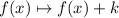 translates the function vertically, k units up if k is positive, k units down if k is negative.
Plz ):
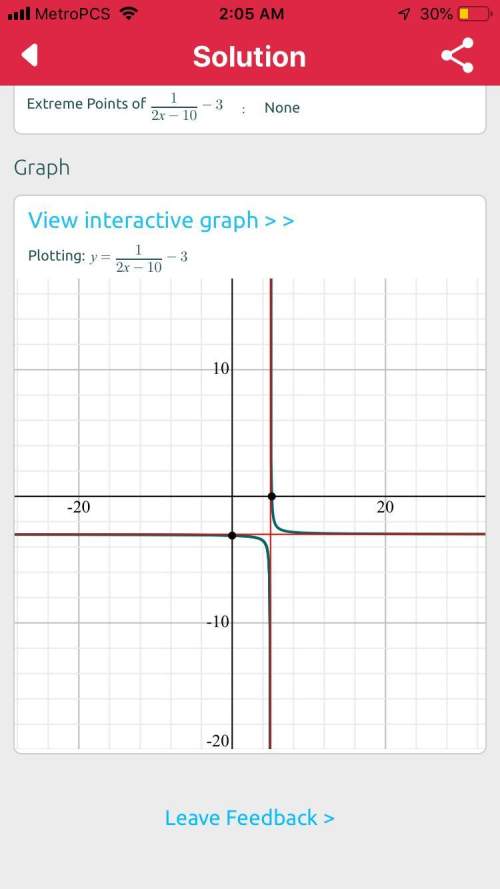
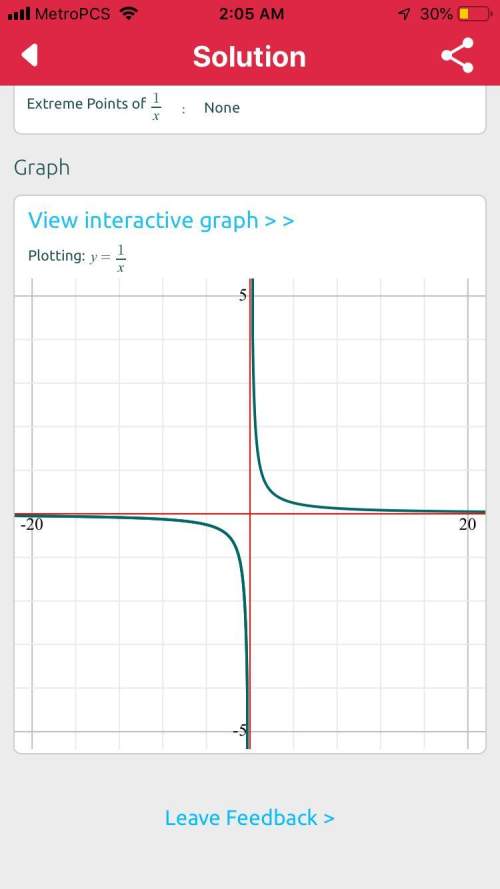
describe the graph y=1/2x-10 -3 compared to the graph of y=1/x
i have no i...

Mathematics, 04.02.2020 07:04 bikerhomie
Plz ):
describe the graph y=1/2x-10 -3 compared to the graph of y=1/x
i have no idea how to word this properly

Answers: 3


Another question on Mathematics
Mathematics, 21.06.2019 16:50
The parabola x = y² - 9 opens: a.)up b.)down c.) right d.)left
Answers: 1
Mathematics, 21.06.2019 19:30
Acar started driving from city a to city b, distance between which is 620 miles, at a rate of 60 mph. two hours later a truck left city b and started moving towards city a at a rate of 40 mph. how many hours after the truck's departure will the two meet?
Answers: 1
Mathematics, 21.06.2019 19:40
It appears that people who are mildly obese are less active than leaner people. one study looked at the average number of minutes per day that people spend standing or walking. among mildly obese people, the mean number of minutes of daily activity (standing or walking) is approximately normally distributed with mean 376 minutes and standard deviation 64 minutes. the mean number of minutes of daily activity for lean people is approximately normally distributed with mean 528 minutes and standard deviation 107 minutes. a researcher records the minutes of activity for an srs of 7 mildly obese people and an srs of 7 lean people. use z-scores rounded to two decimal places to answer the following: what is the probability (image for it appears that people who are mildly obese are less active than leaner people. one study looked at the averag0.0001) that the mean number of minutes of daily activity of the 6 mildly obese people exceeds 420 minutes? what is the probability (image for it appears that people who are mildly obese are less active than leaner people. one study looked at the averag0.0001) that the mean number of minutes of daily activity of the 6 lean people exceeds 420 minutes?
Answers: 1
Mathematics, 21.06.2019 20:00
Someone answer asap for ! max recorded the heights of 500 male humans. he found that the heights were normally distributed around a mean of 177 centimeters. which statements about max’s data must be true? a. the median of max’s data is 250 b. more than half of the data points max recorded were 177 centimeters. c. a data point chosen at random is as likely to be above the mean as it is to be below the mean. d. every height within three standard deviations of the mean is equally likely to be chosen if a data point is selected at random.
Answers: 1
You know the right answer?
Questions
Mathematics, 24.10.2020 05:00

Arts, 24.10.2020 05:00
Mathematics, 24.10.2020 05:00

Mathematics, 24.10.2020 05:00
Mathematics, 24.10.2020 05:00

Social Studies, 24.10.2020 05:00

Mathematics, 24.10.2020 05:00
Mathematics, 24.10.2020 05:00

English, 24.10.2020 05:00
English, 24.10.2020 05:00

Geography, 24.10.2020 05:00


