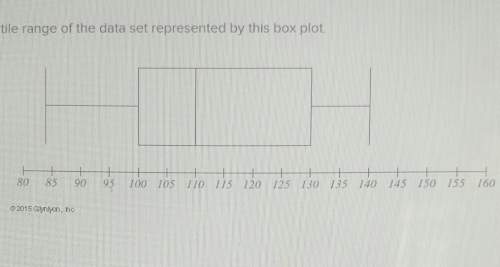
Find the interquartile range of the data represented by this box plot.
a. 10
b. 30<...

Mathematics, 22.10.2019 03:10 stephanie37766
Find the interquartile range of the data represented by this box plot.
a. 10
b. 30
c. 56
d. 20.

Answers: 3


Another question on Mathematics
Mathematics, 21.06.2019 18:00
Marla bought a book for $12.95, a binder for $3.49, and a backpack for $44.99. the sales tax rate is 6%. find the amount of tax and the total she paid for these items
Answers: 3
Mathematics, 21.06.2019 19:00
2pointswhich of the following appear in the diagram below? check all that apply.d a. zcdeов. сеo c. aéo d. zdce
Answers: 1
Mathematics, 22.06.2019 01:00
The stem-and-leaf plot shows the heights in centimeters of teddy bear sunflowers grown in two different types of soil. soil a soil b 5 9 5 2 1 1 6 3 9 5 1 0 7 0 2 3 6 7 8 2 1 8 3 0 9 key: 9|6 means 69 key: 5|8 means 58 calculate the mean of each data set. calculate the mean absolute deviation (mad) of each data set. which set is more variable? how do you know?
Answers: 2
Mathematics, 22.06.2019 02:10
Iknow the answer but the calculator doesn't seem to give the right one
Answers: 1
You know the right answer?
Questions


History, 20.07.2019 14:50
Social Studies, 20.07.2019 14:50


Physics, 20.07.2019 14:50

Health, 20.07.2019 14:50

Biology, 20.07.2019 14:50


