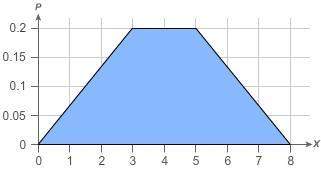
1.  is the area under the curve to the left of
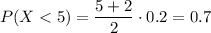
  , which is a trapezoid with "bases" of length 2 and 5 and "height" 0.2, so
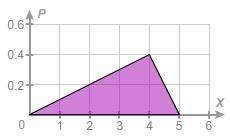
2. Find the area under the curve for each of the specified intervals:
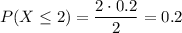 (triangle with base 2 and height 0.2)
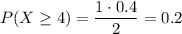 (triangle with base 1 and height 0.4)
 (trapezoid with "bases" 0.2 and 0.4 and "height" 2)
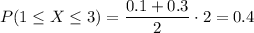 (trapezoid with "bases" 0.1 and 0.3 and "height" 2)