Need this answered asap!
the following table shows the number of hours some high schoo...

Mathematics, 27.09.2019 15:30 angelesramos112
Need this answered asap!
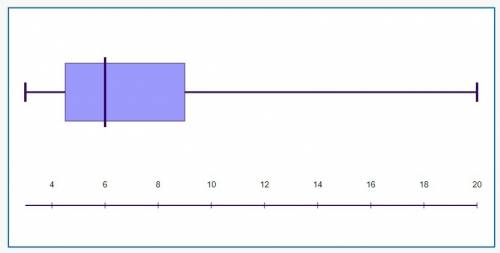
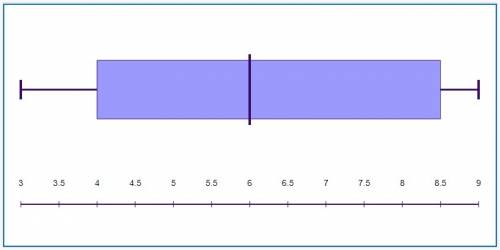
the following table shows the number of hours some high school students in two towns spend riding the bus each week:
town a 5 3 9 4 20 9 5 7 6
town b 8 8 3 5 5 6 3 9 9
part a: create a five-number summary and calculate the interquartile range for the two sets of data.
part b: are the box plots symmetric? justify your answer.

Answers: 1


Another question on Mathematics
Mathematics, 22.06.2019 00:30
Can someone me find the original price? the discount is 5% and the sale price is $68.40
Answers: 1
Mathematics, 22.06.2019 01:00
First work with stencil one. use a combination of reflections, rotations, and translations to see whether stencil one will overlap with the original pattern. list the sequence of rigid transformations you used in your attempt, noting the type of transformation, the direction, the coordinates, and the displacement in
Answers: 3
Mathematics, 22.06.2019 02:10
The formula to determine energy is e=1/2mv2? what is the formula solved for v?
Answers: 1
You know the right answer?
Questions

Chemistry, 05.02.2021 20:40
Mathematics, 05.02.2021 20:40
Mathematics, 05.02.2021 20:40
Mathematics, 05.02.2021 20:40

Arts, 05.02.2021 20:40
Mathematics, 05.02.2021 20:40
Mathematics, 05.02.2021 20:40

Mathematics, 05.02.2021 20:40
Mathematics, 05.02.2021 20:40
Mathematics, 05.02.2021 20:50


