Ineed some , i'm very stumped.
a student boasts that he is the luckiest person alive because i...

Mathematics, 28.01.2020 14:13 magiflores6122
Ineed some , i'm very stumped.
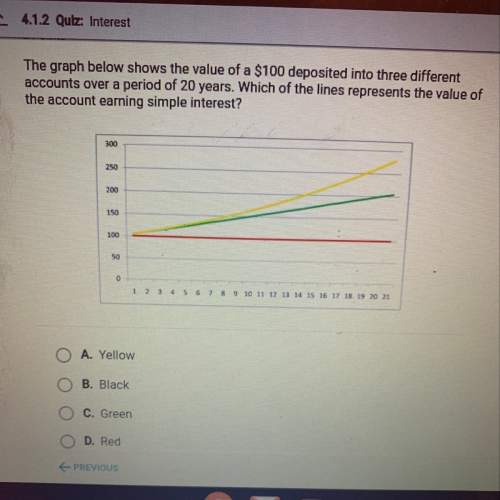
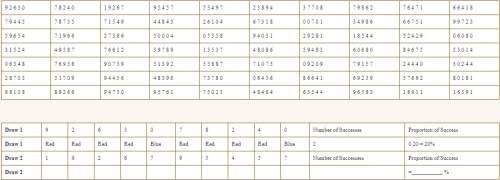
a student boasts that he is the luckiest person alive because in a jar of marbles, in which there were two blue marbles and eight red marbles, he drew a blue marble out of the jar on four successive tries (after replacing the original). skeptical, his friend conducts a simulation using a random number table. the digits 0 and 1 represent a success (drawing a blue marble), and the digits 2 through 9 represent not a success (drawing a red marble). using the first 10 digits in the first row for the first draw and the next 10 digits in the same row for the second draw, he records the successes.
(chart attached)
part a: fill in the empty table cells for draw 2 using the simulation provided.
part b: what is the proportion of success on draw 2?
part c: what reasonable conclusion can be made about the student's claim that he drew four successive blue marbles out of the jar, knowing that the theoretical probability of doing so is 0.2 • 0.2 • 0.2 • 0.2 = 0.0016 = 0.16%?

Answers: 2


Another question on Mathematics
Mathematics, 21.06.2019 23:00
Eden has a part time job. she is paid ? 7.20 an hour the week she worked 18 and a half hours how much is she paid
Answers: 1
Mathematics, 22.06.2019 02:00
1. the manager of collins import autos believes the number of cars sold in a day (q) depends on two factors: (1) the number of hours the dealership is open (h) and (2) the number of salespersons working that day (s). after collecting data for two months (53 days), the manager estimates the following log-linear model: q 4 equation 1 a. explain, how to transform the log-linear model into linear form that can be estimated using multiple regression analysis. the computer output for the multiple regression analysis is shown below: q4 table b. how do you interpret coefficients b and c? if the dealership increases the number of salespersons by 20%, what will be the percentage increase in daily sales? c. test the overall model for statistical significance at the 5% significance level. d. what percent of the total variation in daily auto sales is explained by this equation? what could you suggest to increase this percentage? e. test the intercept for statistical significance at the 5% level of significance. if h and s both equal 0, are sales expected to be 0? explain why or why not? f. test the estimated coefficient b for statistical significance. if the dealership decreases its hours of operation by 10%, what is the expected impact on daily sales?
Answers: 2
Mathematics, 22.06.2019 03:00
With this question, the answer with the red arrow is incorrect!
Answers: 1
Mathematics, 22.06.2019 03:00
What is the solution for the following system of equations? use any method to solve. y = -x +4 y = x - 2 a. ( 4 , -2) b. (2, 1) c. (3, 1) d.(3, -2)
Answers: 2
You know the right answer?
Questions

Mathematics, 24.10.2019 13:43

Mathematics, 24.10.2019 13:43

Social Studies, 24.10.2019 13:43
Mathematics, 24.10.2019 13:43
Mathematics, 24.10.2019 13:43

Biology, 24.10.2019 13:43
History, 24.10.2019 13:43
Biology, 24.10.2019 13:43

Computers and Technology, 24.10.2019 13:43

Mathematics, 24.10.2019 13:43

Chemistry, 24.10.2019 13:43
Mathematics, 24.10.2019 13:43
History, 24.10.2019 13:43

Health, 24.10.2019 13:43


