Pls hurry! i will give
xavier created a scatterplot and a trend line for data that he collec...

Mathematics, 20.09.2019 07:00 rosehayden21
Pls hurry! i will give
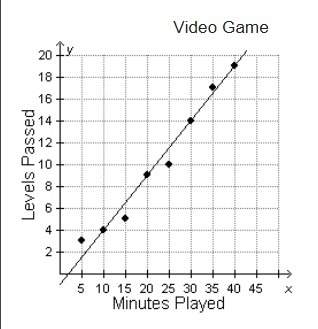
xavier created a scatterplot and a trend line for data that he collected by comparing the number of minutes he spent playing a game and the number of levels he passed.
according to the graph, which combination of minutes played and levels passed seem most likely to be possible?
a) 2 minutes played and 3 levels passed
b) 17 minutes played and 35 levels passed
c) 20 minutes played and 9 levels passed
d) 50 minutes played and 19 levels passed

Answers: 2


Another question on Mathematics
Mathematics, 21.06.2019 19:00
Ab based on the given diagram, if m_1 = 60° then m 2 = 30 60 90 180
Answers: 1
Mathematics, 21.06.2019 19:00
The length of a rectangular piece of land is 92 yards more than three times its width. the perimeter is 760 yards. find its dimensions.
Answers: 1
Mathematics, 21.06.2019 22:10
Akitchen is 12 ft. by 14 ft. with 10 ft. high walls. how much would it cost to put vinyl flooring in this room? $8.80 per ft
Answers: 1
Mathematics, 21.06.2019 22:30
Convert (-3,0) to polar form. a. (3,0’) b. (-3,180’) c. (3,180’) d. (3,360’)
Answers: 1
You know the right answer?
Questions

History, 09.07.2019 00:10

English, 09.07.2019 00:10
English, 09.07.2019 00:10


English, 09.07.2019 00:10
Chemistry, 09.07.2019 00:10

Mathematics, 09.07.2019 00:10

Biology, 09.07.2019 00:10

Arts, 09.07.2019 00:10
Mathematics, 09.07.2019 00:10

Social Studies, 09.07.2019 00:10


