
Mathematics, 25.06.2019 04:00 taniyawalker123
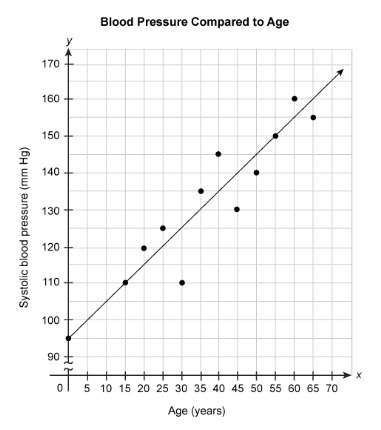
The scatter plot shows the systolic blood pressure of people of several different ages. the equation represents the linear model for this data. y = x + 95 according to the model, how much does the systolic blood pressure increase for each year of age? a. 1 mm hg per yearb. 5 mm hg per yearc. 15 mm hg per yeard. 95 mm hg per yeare. 110 mm hg per yearaccording to the model, what is the systolic blood pressure of someone who is 42 years old? hg

Answers: 1


Another question on Mathematics
Mathematics, 21.06.2019 19:00
What are the solutions of the system? solve by graphing. y = -x^2 - 3x + 2 y = -2x + 2
Answers: 1
Mathematics, 22.06.2019 01:00
If johnny ate 5 cans of sugar, but in the kitchen they only had 3. what did johnny eat? (he found a secret stash btw.)
Answers: 2
Mathematics, 22.06.2019 03:30
How much money does ron have left each month after his fixed expenses? ron graduated from college five years ago. he recently bought a house, but shares it with a housemate who pays him $800 a month for rent and utilities. ron is putting a budget worksheet together so he will have a better idea of where his money is going and where he can save. enlarge
Answers: 3
You know the right answer?
The scatter plot shows the systolic blood pressure of people of several different ages. the equation...
Questions

Physics, 09.09.2020 19:01
Mathematics, 09.09.2020 19:01


History, 09.09.2020 19:01
Mathematics, 09.09.2020 19:01
History, 09.09.2020 19:01
History, 09.09.2020 19:01


History, 09.09.2020 19:01


