
Mathematics, 28.06.2019 15:00 musicalmel
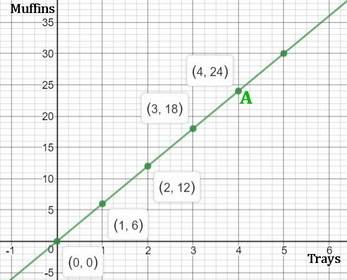
The graph below shows the relationship between the number of muffins made and the number of trays used: a graph is shown. the values on the x axis are 0, 1, 2, 3, 4, 5. the values on the y axis are 0, 6, 12, 18, 24, 30. points are shown on the ordered pairs 0, 0 and 1, 6 and 2, 12 and 3, 18 and 4, 24. only the point on ordered pair 4, 24 is labeled as a. these points are joined by a line. the label on the x axis is trays. the title on the y axis is muffins. which statement best describes point a on the graph? four trays make 24 muffins. four trays make 6 muffins. one tray makes 24 muffins. one tray makes 18 muffins..

Answers: 1


Another question on Mathematics
Mathematics, 21.06.2019 16:40
Which is the graph of f(x) = (4)x? image for option 1 image for option 2 image for option 3 image for option 4
Answers: 1
Mathematics, 21.06.2019 18:20
What value of x is in the solution set of 4x - 12 s 16 + 8x? -10 -9 -8 -7
Answers: 1
Mathematics, 21.06.2019 19:30
At the beginning of 1974/75,2 years a man invested #2000 in a bank at 12.5% compound interest, if it degree #650 at the end of each two years to pay his son's school fees, after payment of interest to pay his son's school fees, how much did he have left at the beginning of the 1978/79 school year?
Answers: 3
Mathematics, 21.06.2019 19:30
[15 points]find the least common multiple of the expressions: 1. 3x^2, 6x - 18 2. 5x, 5x(x +2) 3. x^2 - 9, x + 3 4. x^2 - 3x - 10, x + 2 explain if possible
Answers: 1
You know the right answer?
The graph below shows the relationship between the number of muffins made and the number of trays us...
Questions

Mathematics, 16.12.2020 20:50
Mathematics, 16.12.2020 20:50


Mathematics, 16.12.2020 20:50

Mathematics, 16.12.2020 20:50

Mathematics, 16.12.2020 20:50
English, 16.12.2020 20:50

Computers and Technology, 16.12.2020 20:50
English, 16.12.2020 20:50
Mathematics, 16.12.2020 20:50


