
Mathematics, 01.07.2019 01:00 Delgadojacky0206
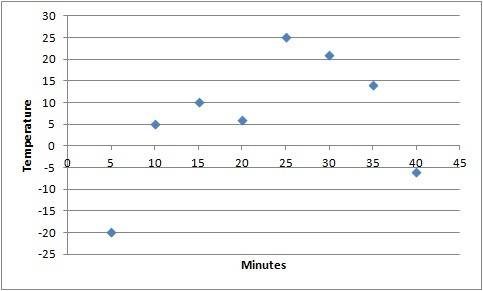
Suppose you are going to graph the data in the table. minutes temperature (°c) 5 -20 10 5 15 10 20 6 25 25 30 21 35 14 40 -6 what data should be represented on each axis, and what should the axis increments be? x-axis: minutes in increments of 5; y-axis: temperature in increments of 1 x-axis: minutes in increments of 5; y-axis: temperature in increments of 5 x-axis: temperature in increments of 5; y-axis: minutes in increments of 1 x-axis: temperature in increments of 1; y-axis: minutes in increments of 5

Answers: 1


Another question on Mathematics
Mathematics, 21.06.2019 15:30
Find the slope of the line below . enter your answer as a fraction or decimal. use a slash mark ( / ) as the fraction bar if necessary
Answers: 3
Mathematics, 21.06.2019 16:00
Aline has a slope of 1/4 and passes through point (0.4,-1/2). what is the value of the y-intercept?
Answers: 2
Mathematics, 21.06.2019 18:00
Adj has a total of 1075 dance and rock songs on her system. the dance selection is 4 times the size of the rock selection. write a system of equations to represent the situation.
Answers: 1
You know the right answer?
Suppose you are going to graph the data in the table. minutes temperature (°c) 5 -20 10 5 15 10 20 6...
Questions


History, 06.04.2020 19:45
Mathematics, 06.04.2020 19:45
Mathematics, 06.04.2020 19:45


Mathematics, 06.04.2020 19:46
History, 06.04.2020 19:46

Physics, 06.04.2020 19:46
Physics, 06.04.2020 19:46


