
Mathematics, 01.07.2019 05:00 mdean858
1. solve. y-5 is less than or equal to 6 (1 point) a) y is less than or equal to 1 b) y is less than or equal to 11*** c) y is less than or equal to -11 d) y is less than or equal to 30 2. solve. 8 > d-2 (1 point) a) d < 10 b) d > 10 c) d < 6 d) d > 4 3. solve. 3.8 is greater than or equal to b + 4 (1 point) a) b is less than or equal to -0.2 b) b is less than or equal to 0.2 c) b is less than or equal to 7.8 d) b is less than or equal to 1.8 also, if anyone knows what the alt code is to make a less than or equal to, and a greater than or equal to symbols, that would be awesome. these are the only alt codes i know, °, •, ÷, ², ®, and √.

Answers: 1
 6, then you can simply move the negative five overt to the other side, making sure to change the sign, making it a positive:
 simplified to
 > d , or simplified 10 > d
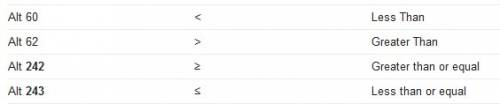


Another question on Mathematics
Mathematics, 21.06.2019 18:50
Determine which expressions represent real numbers and which expressions represent complex number. asaaap! plis!
Answers: 1
Mathematics, 21.06.2019 21:30
In a two-digit number the units' digit is 7 more than the tens' digit. the number with digits reversed is three times as large as the sum of the original number and the two digits. find the number.
Answers: 2
Mathematics, 22.06.2019 00:30
Efficient homemakers ltd. makes canvas wallets and leather wallets as part of a money-making project. for the canvas wallets, they need two yards of canvas and two yards of leather. for the leather wallets, they need four yards of leather and three yards of canvas. their production unit has purchased 44 yards of leather and 40 yards of canvas. let x be the number of leather wallets and y be the number of canvas wallets. draw the graph showing the feasible region to represent the number of the leather and canvas wallets that can be produced.
Answers: 1
Mathematics, 22.06.2019 01:20
1. why is a frequency distribution useful? it allows researchers to see the "shape" of the data. it tells researchers how often the mean occurs in a set of data. it can visually identify the mean. it ignores outliers. 2. the is defined by its mean and standard deviation alone. normal distribution frequency distribution median distribution marginal distribution 3. approximately % of the data in a given sample falls within three standard deviations of the mean if it is normally distributed. 95 68 34 99 4. a data set is said to be if the mean of the data is greater than the median of the data. normally distributed frequency distributed right-skewed left-skewed
Answers: 2
You know the right answer?
1. solve. y-5 is less than or equal to 6 (1 point) a) y is less than or equal to 1 b) y is less than...
Questions

Social Studies, 27.11.2020 21:50
Mathematics, 27.11.2020 21:50

English, 27.11.2020 21:50


Biology, 27.11.2020 21:50

History, 27.11.2020 21:50
History, 27.11.2020 21:50
Business, 27.11.2020 21:50


