
Mathematics, 07.07.2019 04:30 phowhim40
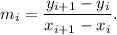
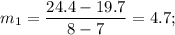
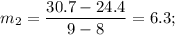
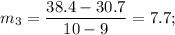
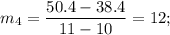
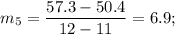
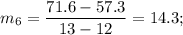
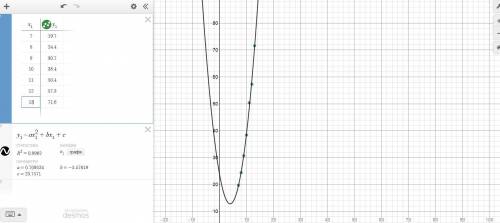
The table shows the profits (y) in millions of dollars for buffalo wild wings for each year (x) from 2007 through 2013, where x=7 represents 2007. year x | profits y 7 | 19.7 8 | 24.4 9 | 30.7 10 | 38.4 11 | 50.4 12 | 57.3 13 | 71.6 a.) sketch a graph b.) use the slopes to determine the years in which the profits showed the greatest or least increases. c.) find the equation of a line between 2007 and 2013 d.) interpret meaning of the slope and line from part (c) in the context of the problem e) use the equation from part (c) to estimate the profit for buffalo wild wings in 2017. do you think that it is an accurate estimate. explain.

Answers: 1


Another question on Mathematics
Mathematics, 21.06.2019 19:20
Which number completes the system of linear inequalities represented by the graph? y> 2x – 2 and x + 4y 2 et 2 3 4
Answers: 3
Mathematics, 21.06.2019 19:30
When x = 3 and y = 5, by how much does the value of 3x2 – 2y exceed the value of 2x2 – 3y ?
Answers: 2
Mathematics, 21.06.2019 21:00
Describe how making an ‘and’ compound sentence effects your solution set
Answers: 1
You know the right answer?
The table shows the profits (y) in millions of dollars for buffalo wild wings for each year (x) from...
Questions
Mathematics, 01.08.2019 03:30

Mathematics, 01.08.2019 03:30


Spanish, 01.08.2019 03:30

Arts, 01.08.2019 03:30

Chemistry, 01.08.2019 03:30

Biology, 01.08.2019 03:30
Mathematics, 01.08.2019 03:30

Mathematics, 01.08.2019 03:30
Social Studies, 01.08.2019 03:30


