
Mathematics, 21.11.2019 04:31 jumpgirll
Ineed math ! i don't understand this assignment at all! it has 5 parts, the first four are charts or graphs i have to fill out and the last one is written reflection of the first four. i'll insert pictures.
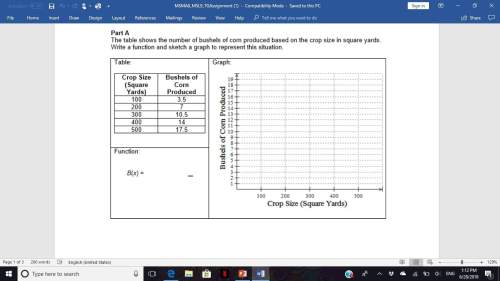
part a
the table shows the number of bushels of corn produced based on the crop size in square yards. write a function and sketch a graph to represent this situation. (see 1st picture) - just tell me what to write for the function, and the coordinates for the sketch
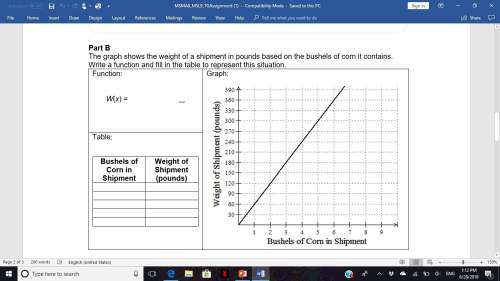
part b
the graph shows the weight of a shipment in pounds based on the bushels of corn it contains.
write a function and fill in the table to represent this situation. (see 2nd picture) - tell me what to write in the table, and what to write for the function
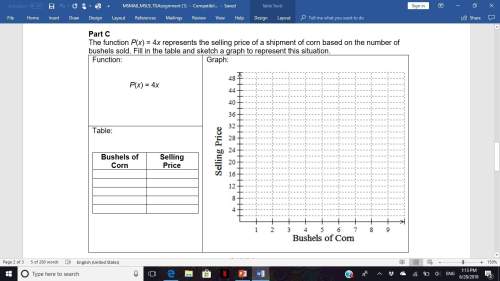
part c
the function p(x) = 4x represents the selling price of a shipment of corn based on the number of bushels sold. fill in the table and sketch a graph to represent this situation. (see 3rd picture) - tell me what to write in the table, and the coordinates for the sketch on the graph
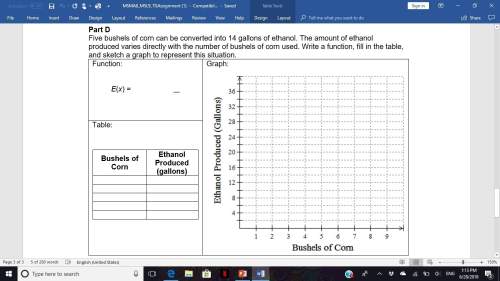
part d
five bushels of corn can be converted into 14 gallons of ethanol. the amount of ethanol produced varies directly with the number of bushels of corn used. write a function, fill in the table, and sketch a graph to represent this situation. (see 4th picture) - this one's really confusing, tell me the function, what to put in the tale, and the coordinates for the sketch on the graph
part e
look back at all of these examples of direct linear variation which are proportional relationships. what common characteristics do they have to distinguish them from non-proportional relationships? what distinguishes their equations from non-proportional relationships?
if you do , you. if you can't , don't answer anything. answers only . late answers welcome, because better late than never.
||45 points||

Answers: 2


Another question on Mathematics
Mathematics, 21.06.2019 13:30
Adding and subtracting matricesfind the value of each variable. x = and y = would
Answers: 3
Mathematics, 21.06.2019 19:50
If your teacher tells you to do questions 6 through 19 in your math book for homework, how many questions is that
Answers: 1
Mathematics, 21.06.2019 23:10
Which best describes the function on the graph? direct variation; k = −2 direct variation; k = -1/2 inverse variation; k = −2 inverse variation; k = -1/2
Answers: 2
You know the right answer?
Ineed math ! i don't understand this assignment at all! it has 5 parts, the first four are charts...
Questions
Mathematics, 16.07.2019 18:30


English, 16.07.2019 18:30
Mathematics, 16.07.2019 18:30
English, 16.07.2019 18:30

Mathematics, 16.07.2019 18:30
Mathematics, 16.07.2019 18:30
Mathematics, 16.07.2019 18:30

Social Studies, 16.07.2019 18:30

History, 16.07.2019 18:30

Biology, 16.07.2019 18:30


