History, 06.05.2020 04:27 tinajackson6534
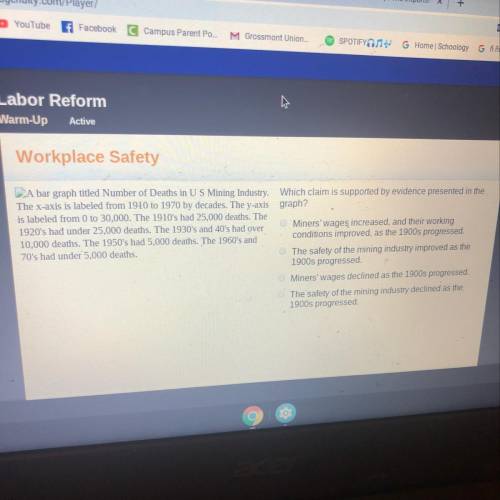
A bar graph titled Number of Deaths in US Mining Industry. Which claim is supported by evidence presented in the
The x-axis is labeled from 1910 to 1970 by decades. The y-axis graph?
is labeled from 0 to 30,000. The 1910's had 25,000 deaths. The
1920's had under 25,000 deaths. The 1930's and 40's had over
Miners' wages increased, and their working
conditions improved, as the 1900s progressed.
10,000 deaths. The 1950's had 5,000 deaths. The 1960's and
70's had under 5,000 deaths.
The safety of the mining industry improved as the
1900s progressed.
Miners' wages declined as the 1900s progressed.
The safety of the mining industry declined as the
1900s progressed


Answers: 2


Another question on History

History, 21.06.2019 22:30
Which best describes how president kennedy apples to the audiences at the beginning of his speech?
Answers: 1

History, 21.06.2019 23:30
Concordtv: did the media show any bias while covering the concord city election? explain your response.
Answers: 2

History, 22.06.2019 00:10
Pls. i will give you 40 points colonists felt the increased taxes in the 1760s and 1770s violated which document? the virginia declaration of rights the mayflower compact the english bill of rights common sense
Answers: 1

You know the right answer?
A bar graph titled Number of Deaths in US Mining Industry. Which claim is supported by evidence pres...
Questions

Mathematics, 07.01.2020 04:31

Mathematics, 07.01.2020 04:31

History, 07.01.2020 04:31

Biology, 07.01.2020 04:31

Mathematics, 07.01.2020 04:31


English, 07.01.2020 04:31


Mathematics, 07.01.2020 04:31

History, 07.01.2020 04:31


Mathematics, 07.01.2020 04:31


Mathematics, 07.01.2020 04:31

Mathematics, 07.01.2020 04:31

Mathematics, 07.01.2020 04:31


Mathematics, 07.01.2020 04:31


Social Studies, 07.01.2020 04:31


