Look at the circle graph.
US Incomes, 1890
A circle graph titled U S Incomes...

History, 25.04.2020 18:15 thanitoast84
Look at the circle graph.
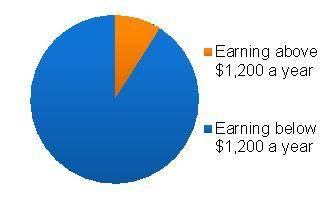
US Incomes, 1890
A circle graph titled U S Incomes, 1890. About one-tenth of the pie is shaded orange and labeled Earning above 1,200 dollars a year. The rest of the pie is labeled Earning below 1,200 dollars a year.
What does the graph tell you about the balance of income during the late 1800s?
a) Most people did not earn more than $1,200 in a year.
b) Most people earned enough money to support their families.
c) Most people earned about the same amount of money.
d) Most people were factory or company owners.

Answers: 1


Another question on History
History, 21.06.2019 15:30
Describe at least one way in which the executive branch is able to influence the actions of the legislative branch and at least one way in which it is able to influence the actions of the judicial branch
Answers: 1
History, 22.06.2019 08:30
Mee why did the government control the news and information americans received about the war? to eliminate propaganda that unfairly targeted immigrants to influence public opinion in support of the war effort to inform americans about troop movements and major battles
Answers: 1
History, 22.06.2019 09:30
How many people lost their jobs when the minimum wage increased from $12 to $18?
Answers: 1
You know the right answer?
Questions


Spanish, 15.04.2021 01:00
Mathematics, 15.04.2021 01:00
Mathematics, 15.04.2021 01:00
History, 15.04.2021 01:00
Mathematics, 15.04.2021 01:00

Health, 15.04.2021 01:00
Mathematics, 15.04.2021 01:00
Mathematics, 15.04.2021 01:00

English, 15.04.2021 01:00
Mathematics, 15.04.2021 01:00

Biology, 15.04.2021 01:00
Mathematics, 15.04.2021 01:00


