
The graph plots observed landslide events relative to the duration and rate of
rain that happened before the event. Based on the information contained in the
graph
A) land surfaces with a steeper slope require less rain to start a landslide than shallower slopes.
B) no clear correlation exists between the duration and rate of rainfall and the occurrence of a landslide.
C) landslides after rain of a longer duration tend to be larger than those after shorter rain events.
D) if a rain event leading to a landslide was short in duration, the rain rate tended to be much higher than for other events.
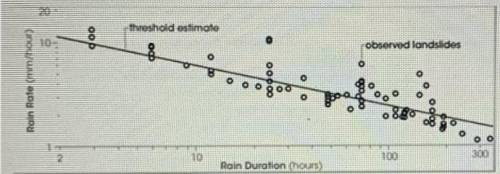

Answers: 3


Another question on Geography
Geography, 22.06.2019 18:00
Nwhat way does renewable energy differ from nonrenewable energy?
Answers: 1
Geography, 22.06.2019 19:10
One of the brightest comets of the 20th century was comet hyakutake, which passed close to the sun in early 1996. the orbital period of this comet is estimated to be about 30,000 years. find the semi-major axis of this comet’s orbit. compare it to the average sun-pluto distance and to the distance to alpha centauri, the nearest star to the sun, which is 4.3 light-years distant.
Answers: 3
Geography, 23.06.2019 14:20
At which boundary does subduction stop occurring, resulting in a mountain range?
Answers: 2
You know the right answer?
The graph plots observed landslide events relative to the duration and rate of
rain that happened b...
Questions

History, 24.04.2021 06:20

Mathematics, 24.04.2021 06:20


Mathematics, 24.04.2021 06:20
Mathematics, 24.04.2021 06:20

Physics, 24.04.2021 06:20
English, 24.04.2021 06:20
Mathematics, 24.04.2021 06:20
Mathematics, 24.04.2021 06:20
Mathematics, 24.04.2021 06:20
English, 24.04.2021 06:20
Mathematics, 24.04.2021 06:20
English, 24.04.2021 06:20


