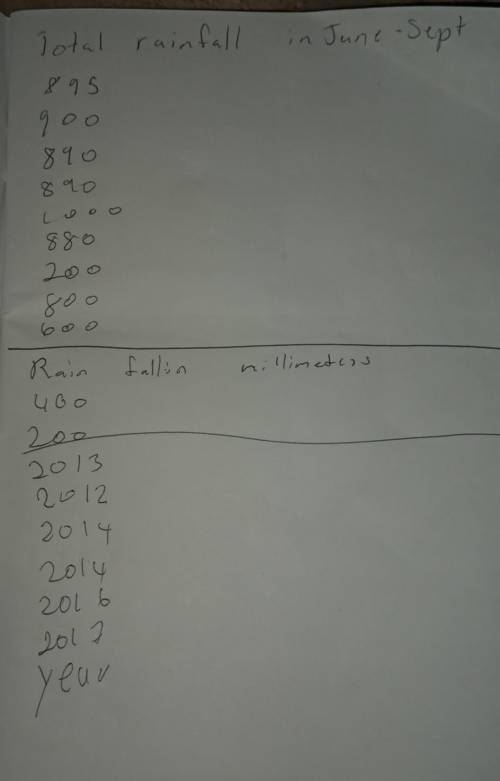
The data of rainfall in the years 2012-2017
is presented in the graph given below.
Write an an...

The data of rainfall in the years 2012-2017
is presented in the graph given below.
Write an analytical paragraph describing
the data
in 100-120 words.
Rainfall in August and rainfall during the entire June-
September season over the years
In August
Total Rainfall in June-Sept
895
900
890
890
1000
880
700
800
600
Rainfallin millimeters
400
200
2013
2012
2014
2015
2016
2017
Year

Answers: 1


Another question on English
English, 22.06.2019 00:30
I’m cruel tribute which characters action most advance the development of the plot?
Answers: 1
English, 22.06.2019 00:30
Hur ! asap what is the structure of the following sentence? although i have already visited africa, i would certainly like to return. a) compound b) compound-complex c) complex d) simple
Answers: 1
English, 22.06.2019 10:00
Ineed . read the passage, and choose the two (2) inferences that are most firmly based on the given information. experts have blamed caffeine for bone loss among older women. but a university study of 138 older women found that caffeine had no such effect. in that study, women who drank more than five cups of coffee a day had the same bone density as women who got little caffeine. 1. bone loss among older women is not a problem. 2. the experts who blamed caffeine for bone loss may be wrong. 3. caffeine causes healthy bones. 4. some older wome
Answers: 1
You know the right answer?
Questions

History, 29.10.2020 03:30

Mathematics, 29.10.2020 03:30


Arts, 29.10.2020 03:30

Biology, 29.10.2020 03:30
Mathematics, 29.10.2020 03:30

Advanced Placement (AP), 29.10.2020 03:30
Engineering, 29.10.2020 03:30
Mathematics, 29.10.2020 03:30
Mathematics, 29.10.2020 03:30

Mathematics, 29.10.2020 03:30
Biology, 29.10.2020 03:30


